Dear Investor,
Currently on some days stock prices are dropping like stones. Therefore, knowing on which days of the week prices typically decline sharply is of great value to investors.
Today, I will examine the performance of the S&P 500 Index on individual days of the week.
You won’t believe it: Even in this crash, there are days of the week on which stock prices actually rose!
But first I will come to the long-term analysis.
Tuesday is a particularly strong trading day
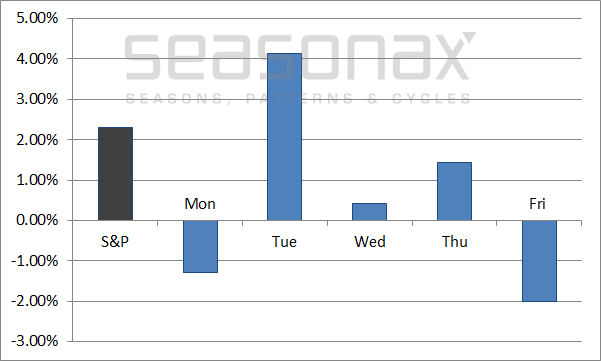
The chart below shows the annualized performance of the S&P 500 Index since the turn of the century in black, as well as the cumulative annualized return generated on individual days of the week in blue.
I have measured the price changes from close to close; thus the performance of e.g. Tuesday represents the difference between the close on Monday and the close on Tuesday.
S&P 500 Index, performance by individual days of the week, 2000 to 2020 – annualized

Tuesday alone beats the entire period.
Source: Seasonax
As you can see, one day is standing out in terms of positive performance: Tuesday. The cumulative return of the stock market on Tuesdays alone was actually much better than that achieved on all five trading days combined! Tuesdays have generated an annual return of 4.13%, compared to only 2.31% for the S&P 500.
By contrast, Monday and Friday were weak on average.
The difference, which was measured over no less than 5,086 trading days, is quite significant. This suggests it is unlikely to merely be a random phenomenon.
How does this look like in specific market environments though, i.e., during bull and bear markets?
The days of the week under the microscope
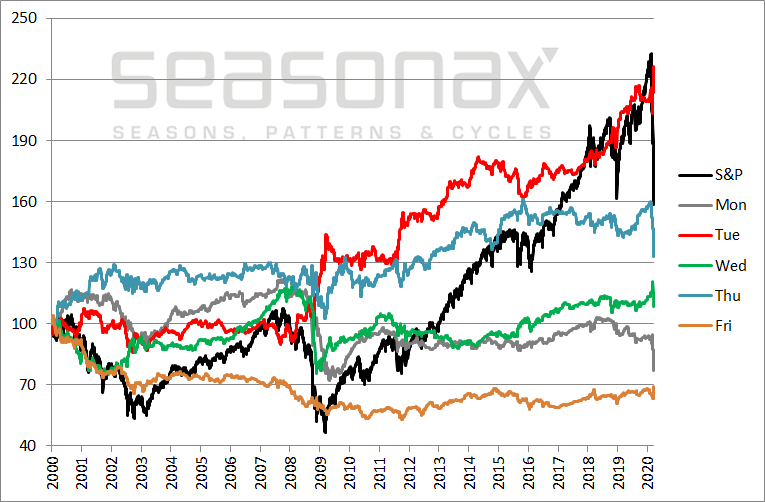
The next chart shows the performance of the S&P 500 Index since the turn of the century in black, as well as the cumulative return achieved on individual days of the week in other colors – all indexed to 100.

Even in 2008 investing exclusively on Tuesdays generated a gain!
Source: Seasonax
Take a close look at the performances during the bear market after the year 2000 peak and in the course of the 2008 financial crisis. Even in these otherwise difficult times for the market, Tuesdays (red) and Thursdays (blue) delivered pretty decent results.
In 2008, the cumulative return generated on Tuesdays was even significantly positive, against the market trend!
Corona Crash: Tuesday is rising again!
The next chart shows the performance of the S&P 500 Index since Friday, February 14, 2020 (the last Friday before the market top) in black until Friday, March 20, 2020, as well as the cumulative return achieved on individual days of the week in other colors – all indexed to 100.
S&P 500 Index, cumulative returns by day of the week, during Corona Crash, indexed

Like in 2008, investing exclusively on Tuesdays generated a gain!
Source: Seasonax
As you can see, stocks rose sharply on Tuesdays even during the Corona Crash Thursday and Monday were weak.
So Tuesday has proven its worth once again!
The reason for Tuesday’s strength is probably a technical reaction to the typical Monday weakness. The reason for the latter might be that investors can develop more negative thoughts and moods over the long weekend.
Statistics help investors even in crashes!
As you can see, statistics can help investors even in extremely difficult times. But there are many more patterns you can benefit from
Achieve now better performance, reduce your risk and back your decisions statistically by using Seasonax!
Dimitri Speck
Founder and head analyst of Seasonax


