Dear Investor,
In recent months, many commodities have seen marked rises. On the other hand, precious metals have lagged behind.
However, in view of this commodity boom, you may be asking if gold will in fact follow suit and also rise spectacularly?
Seasonality can give you an answer. Gold, like many commodities, has a typical seasonal pattern. Let us turn to consider this now.
A seasonal chart shows you the seasonal trend at a glance
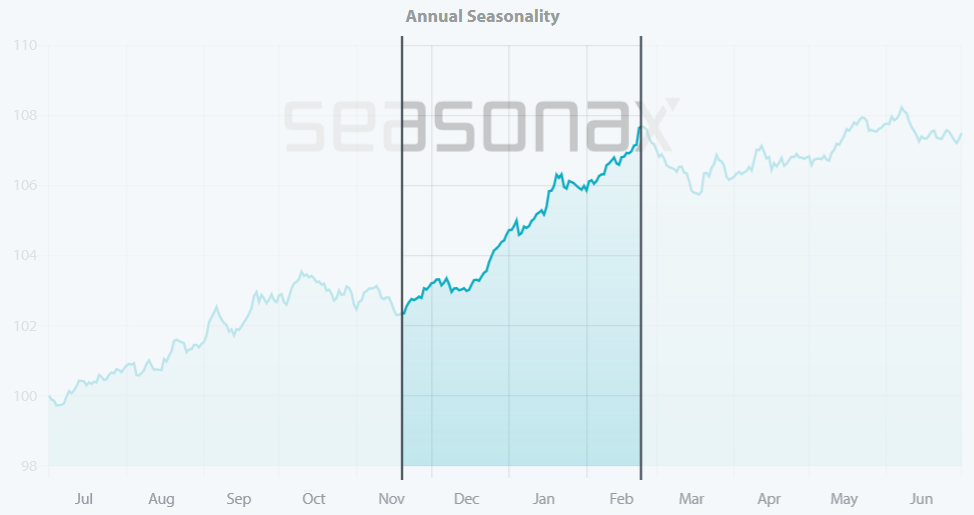
This chart indicates the seasonal course of the price of gold. Unlike more typical charts, it does not show the price over a certain period of time, but the average course of returns over 53 years depending on the season.
The horizontal axis represents the time of the year, while the vertical axis shows price information. This means you can see the seasonal trend at a glance.
The seasonal trend is shown starting from July and not January, as is usually the case. This allows you to see the pattern that extends beyond the turn of the year more easily. Nevertheless, if you do want to move to the beginning of the chart, just click on the arrows above the chart.
Gold in US dollars, seasonal trend determined over 53 years

From mid-November gold typically rises. Source: Seasonax
As is apparent, gold rises seasonally from mid-November to the end of February. This positive phase in gold is highlighted above. There is also a second entry point into the steep phase of this seasonal pattern in mid-December.
With an annualized return of over 22 percent, this is the best midlength seasonal phase in gold.
At first glance, the hit rate is somewhat low at 62 percent. However, the rate is put into this perspective because there was a bear market in gold from 1980 to the turn of the millennium, which is also reflected in the pattern’s statistics. This does not change the fundamental strength of the pattern.
The golden autumn has begun. Nothing stands seasonally against a rise in gold.
Best regards,
Dimitri Speck
Founder and Head Analyst of Seasonax
PS: Let the seasons work their magic on you!


