Dear Investor,
As Black Friday approaches, the mere mention of the term puts a smile on the faces of global retailers who are patiently waiting for this day to arrive.
But why is it so important? In the history books, Black Friday commonly referred to the stock market collapse of September 24, 1869. On that day, the price of gold plummeted and the markets crashed in the wake of a conspiracy between two investors, Jay Gould and James Fisk.
However, in today’s issue of Seasonal Insights we will discuss a more pleasant Black Friday with rather optimistic connotations. Black Friday also refers to the first Friday after Thanksgiving, which is symbolically seen as the start of the holiday shopping season. It represents one of the most important retail and consumer spending events in the United States.
Seasonality and Black Friday
As you are no doubt already aware, the seasonal trends of individual stocks are driven by fundamentals. The best-known seasonal drivers include the weather, investor sentiment at certain times of the year, tax and balance sheet deadlines, financial reports, as well as traditional patterns such as the year-end rally. Certain events such as Black Friday also tend to shift the market into “spending gear”.
The online equivalent to Black Friday is Cyber Monday, which takes place on the first Monday after Thanksgiving and is also seen as a reflection of consumer sentiment. In the few days before and after Black Friday, notable profits can be achieved.
Many retailers consider Black Friday to be crucial to the annual performance of their business. The sales figures posted in this time period are setting the tone for the entire retail sector.
Since 2005, Black Friday has reportedly been the busiest shopping day of the year in the United States.
From a statistical perspective there is a clear upward spike in S&P 500 Index in the above mentioned period.
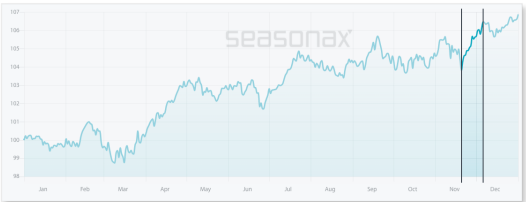
Seasonal Chart of the S&P 500 Index over the past 15 years

The S&P 500 Index typically delivers strong seasonal returns shortly before and after Black Friday.
Source: Seasonax (click here to examine the seasonal chart)
Don’t forget that by clicking on the interactive link, you can highlight the above mentioned period on the chart and take a closer look at a detailed statistical analysis of the pattern.
Note: unlike a standard price chart that simply shows stock prices over a specific time period, a seasonal chart depicts the average price pattern of a stock (or index) in the course of a calendar year, calculated over several years. The horizontal axis depicts the time of the year, while the vertical axis shows the level of the seasonal pattern (indexed to 100). With that in mind, let us examine the seasonal chart of S&P 500 Index.
I have highlighted the strong seasonal phase from November 20 to December 6 calculated over the past 15 years. In this time span of just 11 trading days, the S&P 500 Index rose on average by 2.86 percent. On an annualized basis this is equivalent to quite a large gain of 89.89 percent!
The Battle for Consumer Dollars Begins
Not surprisingly, retail stocks, particularly the stocks of companies that report strong sales, are poised to benefit during this period.
By offering various discounts and bargain shopping retailers try to make their products even more appealing to potential customers. This year, online retailers will definitely enjoy a comparative advantage over traditional retail shops in light of social distancing rules. Last year US shoppers spent more than $7 billion on Black Friday. According to Adobe, online shoppers spent $168 per order on average.
While some traditional stores such as Target and Walmart have successfully transitioned to online shopping, others are still lagging behind. Other giants benefiting greatly from the growth in online shopping include well-known names such as Amazon and Shopify.
Another retail stock that stands out according to our seasonality filter is Lululemon Athletica Inc.
Lululemon Athletica Inc. designs and retails athletic apparel and accessories. The Company produces fitness pants, shorts, tops and jackets for yoga, dance, running, and general fitness pursuits. Lululemon serves customers worldwide and is a retailer perfectly positioned for the COVID era.
Let us take a closer look at the statistics
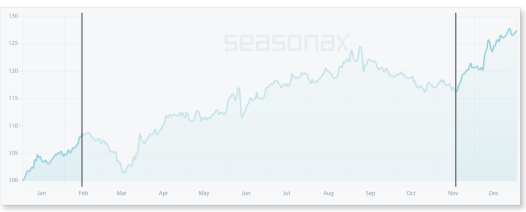
Seasonal Chart of Lululemon Athletica over the past 10 years

Lululemon Athletica Inc. typically delivers strong seasonal returns from mid-November until mid-February.
Source: Seasonax (click here to examine a detailed statistical analysis of the pattern)
I have highlighted the strong seasonal phase from November 17 until February 14 of the following year. On average Lululemon Athletica has delivered a very strong return of 21.21% in the seasonally strong period over the past 10 years, which corresponds to a very respectable annualized gain of 120.38%.
Furthermore the frequency of positive returns generated over time during this phase indicates that the seasonal pattern is consistent and highly reliable.
The bar chart below depicts the return delivered by Lululemon Athletica in the relevant time period from November 17 to February 14 in every year since 2010. Blue bars indicate years with positive returns.
Pattern return for every year since 2010

Source: Seasonax (click here to examine the best period to invest in the selected stock)
Regardless of how Black Friday turns out this year, shopping euphoria should eclipse this year’s market rollercoaster at least for a brief moment. Let the festive season finally begin!
Enter the world of seasonal opportunities
In order to identify other trading opportunities with above-average profit potential, start using our Seasonality Screener.
The Screener is an integral part of your Seasonax subscription and helps find suitable seasonal patterns for profitable trades starting from a specific date.
Discover stocks with strong seasonal patterns that recur almost every calendar year with the help of Seasonax – it will save you time and provide you with a durable edge!
Yours sincerely,
Tea Muratovic
Co-Founder and Managing Partner of Seasonax


