Dear Investor,
Last year around this time, we have been facing our worst fears – our existence and health have been put on the spot. Since then, Covid-19 has forced us to accept a “new normal” and has led to a big shift in our lives and the entire industry. We had to embrace new technologies and learn how to coexist in the digital world. New businesses worth billions of dollars arose, and one sector in particular has pushed its way to the top –

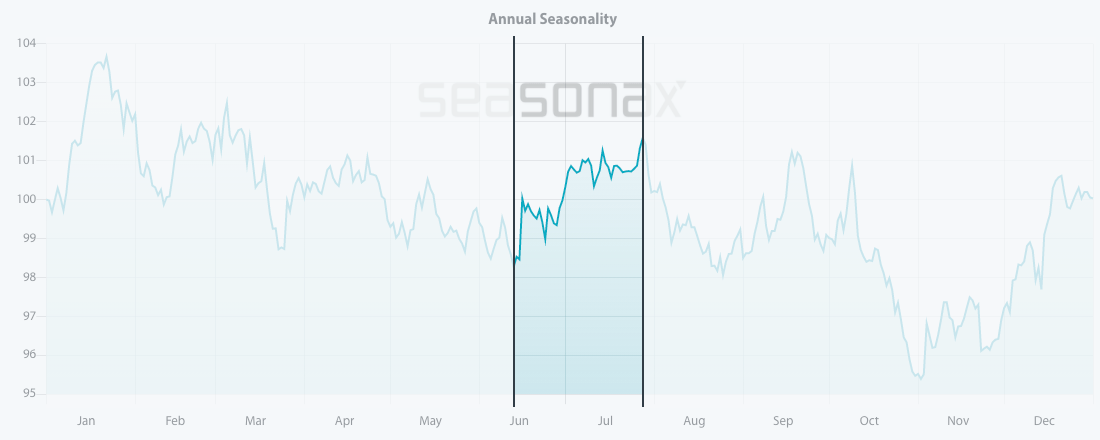
Source: Seasonax – by clicking on the chart image you can highlight the above mentioned time period on the chart and take a closer look at a detailed statistical analysis of the pattern
The upcoming increase in demand can be clearly seen on the seasonal chart of Eli Lilly and Company stock. The stock enters a strong seasonal period from mid-June until the end of July. Let us take a closer look at the statistics.
Keep in mind that unlike a standard price chart that simply shows stock prices over a specific time period, a seasonal chart depicts the average price pattern of a stock in the course of a calendar year, calculated over several years. The horizontal axis depicts the time of the year, while the vertical axis shows the level of the seasonal pattern (indexed to 100).
I have highlighted the upcoming strong seasonal phase from June 13 to July 28 calculated over the past 10 years. In this time span of 32 trading days, the shares of Eli Lilly rose on average by a remarkable 6.04 percent. Furthermore, the frequency of positive returns generated over time during this phase indicates that this seasonal pattern is consistent and highly reliable. The bar chart below depicts the return delivered by Eli Lilly in the highlighted time period from June 13 to July 28 in every single year since 2011.
Pattern return for every year since 2011

Source: Seasonax – please click on the link to conduct further analysis
This positive upcoming trend applies to the entire Health Care Industry as well.
Looking at the CBOE S&P Healthcare Index and its average monthly performance over the past 10 years, we can discern positive returns in June and July.
CBOE S&P Healthcare Index Average Monthly Returns over the past 10 years

Source: Seasonax – please click on the link to conduct further analysis
What the Future Holds
Can we claim that the future is bright? Well, for some companies it definitely is. According to the WHO, around 264 million people worldwide suffered from depression in 2020.
To put it in numbers, Mordor Intelligence reported that the global antidepressant market was valued at approximately USD 14,538 million in 2020, and it is expected to garner revenues of USD 17,233 million by 2026, with a CAGR of 2.68% over the forecast horizon.
The numbers undoubtedly suggest that this sector will deliver a strong performance in the future. Moreover, the rising number of cases of mental health disorders is expected to drive the growth of the antidepressant market. However, the right timing and the seasonal behavior of certain stocks will nevertheless determine the success of your investments. Big players such as Allergan PLC, AstraZeneca, GlaxoSmithKline PLC, H. Johnson & Johnson, Pfizer Inc., Merck & Co. Inc. have their own strong seasonal patterns and cycles that can be easily identified.
Timing is Everything!
Apart from the stocks I have presented in this issue of Seasonal Insights, there are numerous other stocks that display recurring seasonal patterns.
To make finding these opportunities even easier, we have launched a Seasonality Screener. The screener is an analytical tool designed to identify trading opportunities with above-average profit potential starting from a specific date. The algorithms behind the screener are based on predictable seasonal patterns that recur almost every calendar year.
Feel free to analyze more than 20.000+ instruments including stocks, (crypto)currencies, commodities, indexes by signing up for a free trial.
Yours sincerely,
Tea Muratovic
Co-Founder and Managing Partner of Seasonax


