Dear Investor,
Following the tremendous success of previous annual Technical Analysis & Data Visualisation Summit events, Bloomberg is delighted to host the 5th Annual Summit on 14th December 2017.
We aim to enlighten guests with each speaker’s expertise and unique insights, as well as the cutting edge nature of our latest product enhancements.
Save the date: Thursday, December 14th , 2017, 15:00-18:00
Place to be: Bloomberg Office, City Gate House 39-45 Finsbury Square EC2A 1PQ, London
Space is limited, so please register today by replying to tm@seasonax.com.
THE AGENDA:
15:00-15:20 – Introducing the World of Bloomberg Technical Analysis & Data Visualisation Apps
MIKE KING, Bloomberg Business Manager for App Portal and Terminal Connect
15:20-15:40 – Leveraging the Power of the DeMark Studies
GUIDO RIOLO, Bloomberg Market Specialist for Charting, Technical Analysis and Data Visualization
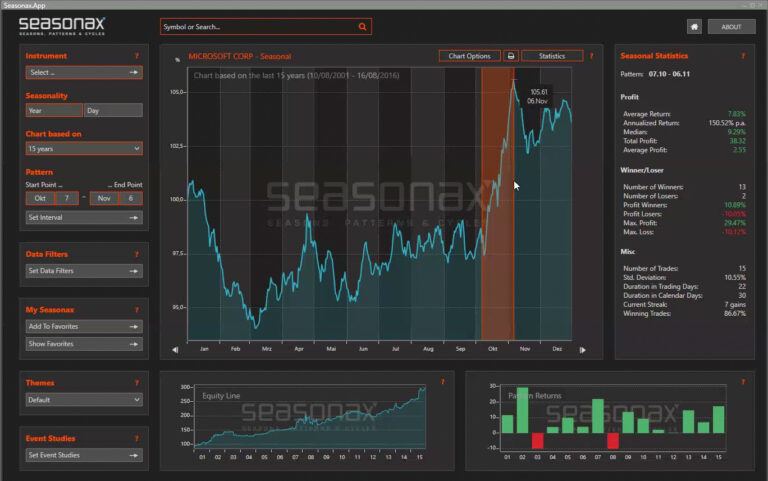
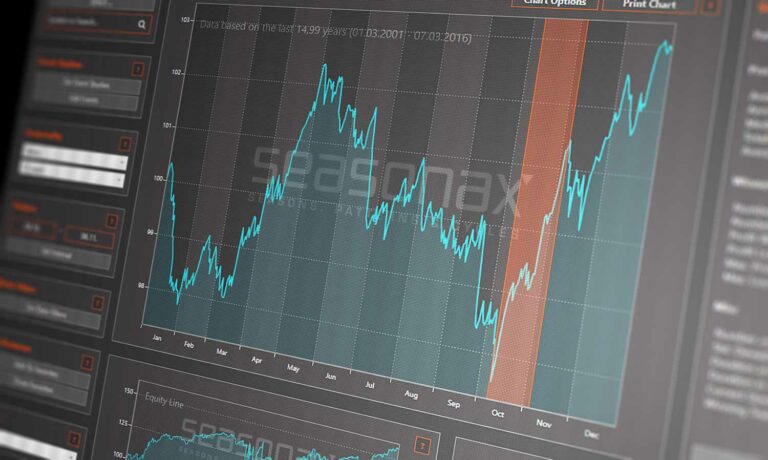
15:40-16:10 – How to Optimise your Market Timing with Seasonality
CHRISTOPH ZENK, Seasonax
16:10-16:30 – Coffee break
16:30-17:00 Rotation Pro – Heatmap Colour Pattern Recognition
CHRISTOPHER GRAFTON, Rotation Pro
17:00-17:20 – Portfolio Factor Backtesting with Technical Criteria
OLIVER WOOLF – Bloomberg Market Specialist for Charting, Technical Analysis and Data Visualization
17:20-17:40 – Timing Market Entries Using the RSI Breadth Entry Trigger (rsiBET)
EOGHAN LEAHY – Bloomberg Market Specialist for Charting, Technical Analysis and Data Visualization
17:40-18:00 – A Look into the Future: An Insight into the Latest Innovations for 2018
ERNIE POPKE – Bloomberg Product Manager for Technical Analysis


