Over the weekend OPEC+ agreed to extend their collective production cuts through to the end of 2025. Previously, the cuts of around 3.6 million bpd, were expected to end this year. On top of this the voluntary cuts from eight states of around 2.2 million bpd were extended from the end of Q2 2024 through to Q3 2024. So, why is the market not obviously moving higher on this? The reason is that the meeting also includes news that production will be gradually increased from Oct 2024 (depending on market conditions). So, the two way news is mirrored by the two way seasonal pattern for oil. From June 04 through to July 13 oil has an upside bias with a 68% winning percentage and an average return of 2.84%.
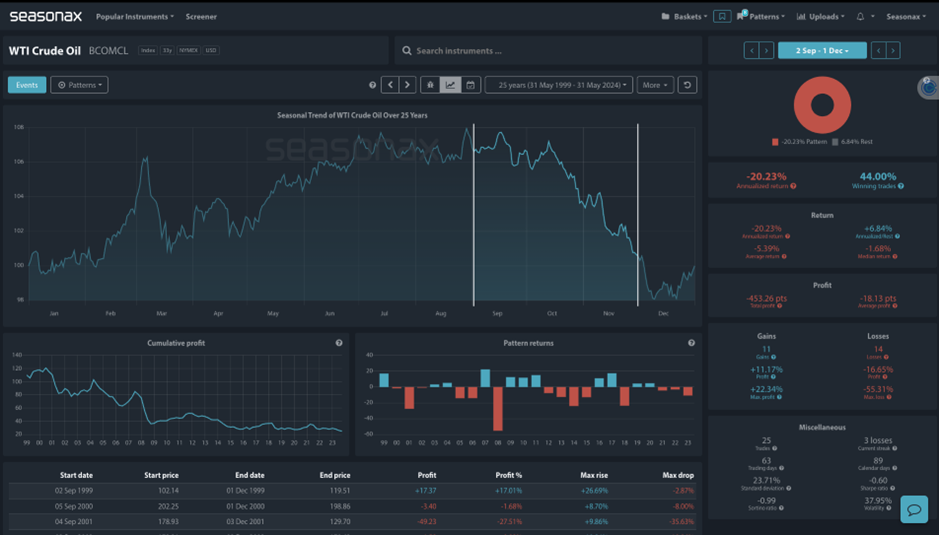
However, that seasonal pattern sharply changes as we come into the Autumn. From September 02, through to December the 01 oil has a 56% losing trade percentage with a 5.39% average loss.
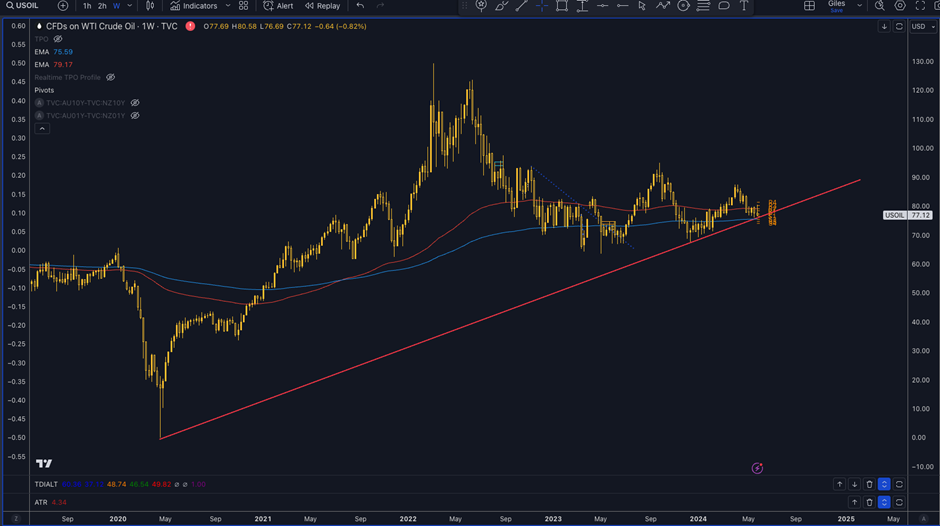
Technically there is a strong potential trendline on the weekly chart running from the weekly lows of April 20th 2020 and December lows of 2023. A clear break below this level would show the bears gaining control and stops would likely sit above $80 on any sharp drop lower.
Sign up here for thousands of more seasonal insights just waiting to be revealed!
The major trade risk here is that oil demand will very much depend on the outlook for global growth which is closely tied to the outlook for global interest rates.
Remember, don’t just trade it Seasonax It!