Dear Investor,
I am often asked how, as an investor, you can best profit from seasonality.
Today, I want to focus on this one topic in detail. I hope that this will help you to deal with seasonality just as easily as moving averages, or price/earnings ratios. At the same time, I hope this makes clear the secret of seasonality, so that you can use it to significantly increase your profit margins!
Put simply – seasonality works!
To illustrate the basic problem that many investors have with seasonality, I would like to start with a very simple example.
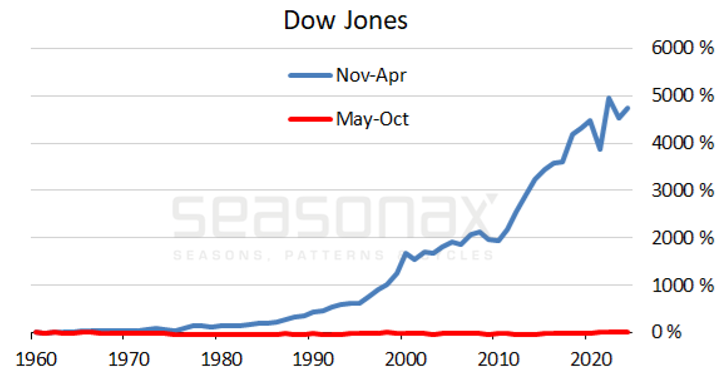
You probably know the saying: “Sell in May and go away!” There is a lot of truth in this classic. Over the last 64 years, an investment in the Dow Jones achieved an average return of 6.60% in the winter half of the year, but only 0.09% in the summer half of the year from May – so practically nothing.
The graph below shows you how well this saying applies since 1960. In blue, you can see the return in percent that a Dow Jones investment would have achieved from November to April – that is, if the saying had been followed. By comparison, you can see the yield during the summer months in red.
Performance during the summer (blue) and the winter (red)

Almost all the profit occurred in the winter half of the year: Source, Seasonax
Here, the power of seasonality in the stock markets is clear. Virtually all of the performance over these sixty plus years has been achieved during the seasonally good months.
But how can investors make money with this knowledge? After all, the graph only says that on average there is no money to be made in the summer.
But this is where most investors fail! If they hadn’t invested in the summer, they would simply have achieved the same return as someone else who had invested all year. That is not a win. It is why the “Sell in May” saying is very popular on the one hand – it shows seasonality works; but on the other hand, only a few investors act on it, because it doesn’t bring them any profit.
So, how is it possible to make money with seasonality?
Yes, winning with seasonality is possible! This is exactly what we specialize in here at Seasonax.
As you know, the Dow Jones is not a single stock. Instead, it represents the course of the market and is calculated as the average of 30 stocks.
But these 30 stocks don’t move exactly in tandem: sometimes one rises, and the other falls; or one rises very sharply, and the other barely moves.
It is clear that stocks often perform differently. This also applies to many thousands of other stocks that are not included in the Dow Jones.
So, what about the seasonal trends of the individual stocks? Shouldn’t they also be different, if stocks follow different trends?
Stocks have individual seasonal patterns!
Exactly this – different stocks have different seasonal patterns. At any time of the year there are individual stocks that are rising strongly.
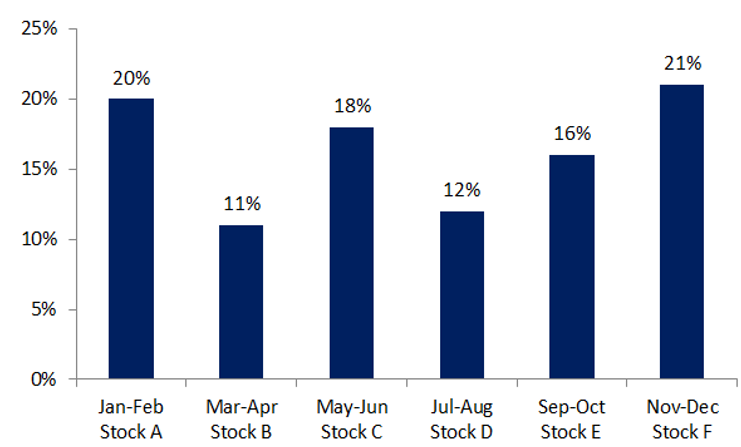
In the following schematic diagram, stock A has its best performance from January to February at 20%; then stock B from March to April at 11%; then stock C, etc.
Stock – Performance, seasonal, schematic

Individual stocks have their best season. Source: Seasonax
It is unimportant in this overview what the performance of the individual stock is during the rest of the year.
Share A, with its 20% decline from January to February, can fall by an average of 10% from March to December.
Most investors will be unaware of the seasonal behaviour of stock A. They inevitably settle for the 10% total return.
Even if they noticed that share A usually only performs well at the beginning of the year, they would still lack the exact information. So they don’t know that they would have doubled their profit on stock A if they had only held it for two months from January to February, rather than for the whole year.
Above all, these investors would have liquid assets free for the remaining ten months if they had only invested in stock A during the best season. These funds could then be invested in other stocks. Of course, they should then prefer the stocks that are having their best season. In the example above, these stocks are B, C, D, E and F.
Now you can see the idea of strategic opportunities that arise from the fact that, unlike the average, the individual stocks have their own individual seasonal patterns – as is the nature of the average. However, very few investors know about this potential.
How can you as an investor actually implement this?
Increase your profits by cascading
I would like to demonstrate this schematically. Let’s assume that you invest in stock A from January to February, when it has a good seasonal phase of +20%. Then, you invest in stock B from March to April in its good seasonal phase of +11%. Then, stock C etc.
By moving from one stock to the next, stringing together seasonal patterns, you can combine these returns. In this way, you solve the “Sell in May” rule which means that you sell at the beginning of May, but you don’t win anything.
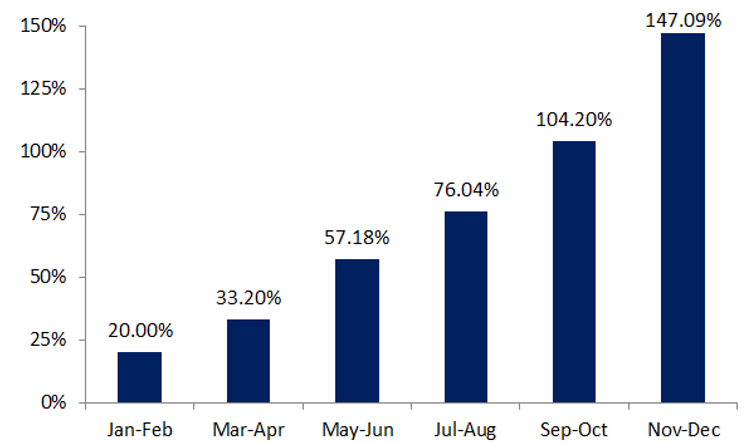
The diagram below shows you the increase in yield schematically. Remember, profits are reinvested. Taking into account the effect of compound interest, the following development of profit results:
Cascading seasonal yield, schematic

Cascading helps increase yield. Source: Seasonax
Mathematically, this results in a return of +147.09%!
The secret of the seasonal stock strategy
Firstly, you invest in the seasonally attractive stock A, then in stock B, then in stock C, etc.
The seasonal individual stock strategy consists of the following three components:
To only be invested in a stock in the best season.
To use the liquidity in the remaining time for the best season of other stocks.
The compound interest effect further increases the return because the interim profit is reinvested.
Of course, in reality things on the stock market are not as regular as in the schematic effect example, with best phases in exactly the same sequence. Additionally, the past is not a guarantee of the future in any investment strategy. Nevertheless, there is the individual seasonality of individual stocks that can significantly increase your probability of winning.
The next difficulty is finding these stocks. Seasonax largely takes this work away with the screener, the featured patterns or the precise seasonal charts.
However, you may still be wondering what causes individual stocks to exhibit seasonal trends. Often these are internal company processes. For example, these ensure that company profits are disproportionally high in certain quarters; or that trade fairs take place at certain times, which are followed by orders and good press. In the case of agricultural or tourism stocks, the season has a direct effect.
It is important to note that there are enough stocks that have a good seasonal phase at any time of the year. You can make profit by always investing in stocks at the seasonally attractive periods.
Now all you have to do is trade seasonally. It’s no more difficult with Seasonax than moving averages or price/earnings ratios.
Kind regards
Dimitri Speck
Founder and Chief Analyst of Seasonax
PS I am happy for you when you make profits with seasonality!


