Dear Investor,
Bitcoin is on everyone’s lips.
With gains of over 100 million percent since its creation, it is the best investment instrument of all time.
But what goes up can also go down.
You may be asking yourself: is the current decline just another correction or the start of a longer bear market?
I would like to give you the seasonal answer today, because Bitcoin price’s also have a seasonal pattern.
The seasonality of Bitcoin under the magnifying glass
So let’s look at the seasonality of Bitcoin in the following seasonal chart. This shows you the course of Bitcoin price dependent on the season. The horizontal axis represents the time of the year, the vertical axis the value of the seasonal axis. This means that you can see the seasonal course at a glance.
Bitcoin, seasonal course, determined over 10 years
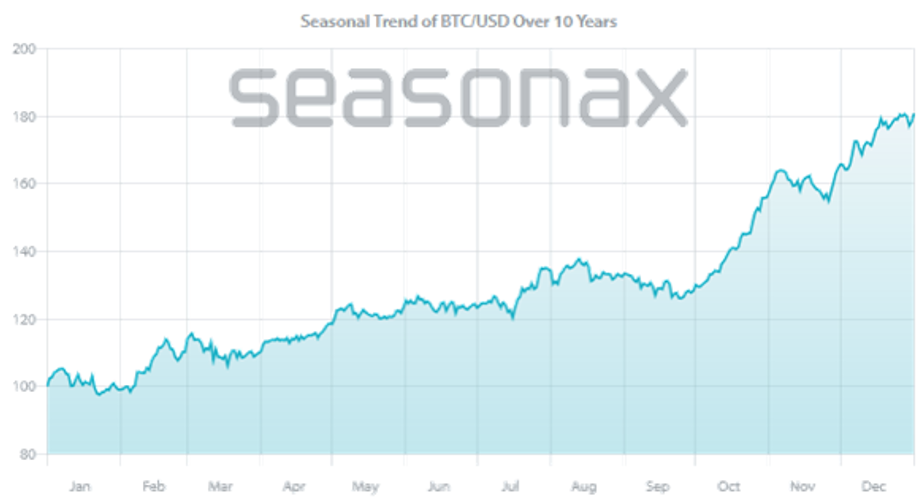
By the end of September, it is only a relatively moderate upward trend. Source: Seasonax
As you can see, Bitcoin usually goes up or sideways. There are hardly any phases of weakness.
This strong increase in the past also makes it difficult to clearly recognise potentially weak phases.
But there is a solution.
Detrending increases seasonal trend visibility
This Seasonax function solution for this is called “Detrending“.
Detrending means that the overarching upward trend is removed. At a glance, you can see very clearly where the relatively weak phases are.
The next chart will show you the detrended seasonal pattern of Bitcoin.
Bitcoin, detrended seasonal pattern examined over the past 10 years
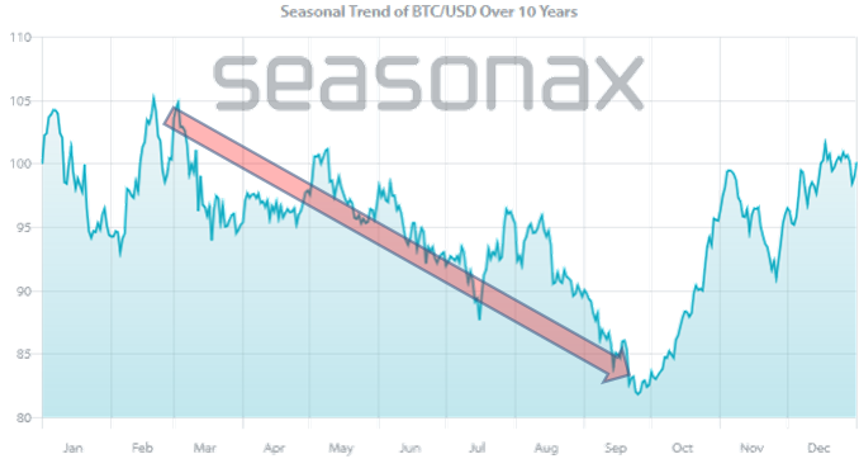
The seasonal phases of weakness are now easy to see. Source: Seasonax.
As you can see, detrending clearly reinforces the seasonal trends visually.
At a glance you can also see the relatively weak seasonal phase much more easily. I have marked it for you with an arrow.
The relative seasonal weakness in Bitcoin begins on February 20th and ends on September 25th.
In this phase, declines in Bitcoin are more likely.
So the current decline can continue for a while – be careful!
Switch for Detrending in Seasonax
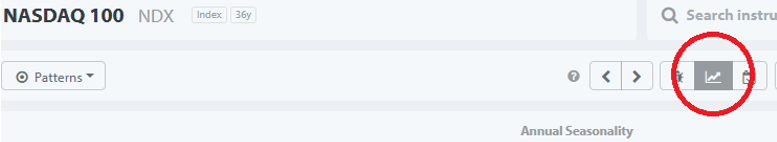
Detrending makes the Seasonal trend more visible. Source: Seasonax
In the detrended chart you can clearly see and identify seasonal trends more quickly.
This makes it easier to analyze periods of weakness, especially when looking at instruments that have risen sharply in the past.
This also allows you to more effectively assess when risk may be imminent.
Use detrending to minimise your risks and further increase your profits.
Kind regards,
Dimitri Speck
Founder and Chief Analyst of Seasonax
PS: Try Seasonax detrending now!