Dear Investor,
You may not realize it, but April has historically been the strongest month of the year for the FTSE 100, delivering consistent gains over the past 25 years. However, this year, investors must weigh this bullish seasonal trend against the backdrop of UK fiscal tightening, with UK Chancellor Rachel Reeves set to deliver the Spring Statement on March 26. Markets will closely watch for spending cuts, tax adjustments, and revisions to economic forecasts. Given the challenging macroeconomic backdrop, will the FTSE 100 once again follow its strong seasonal pattern, or will fiscal tightening cap potential gains? Let’s analyze the seasonal data in more detail.
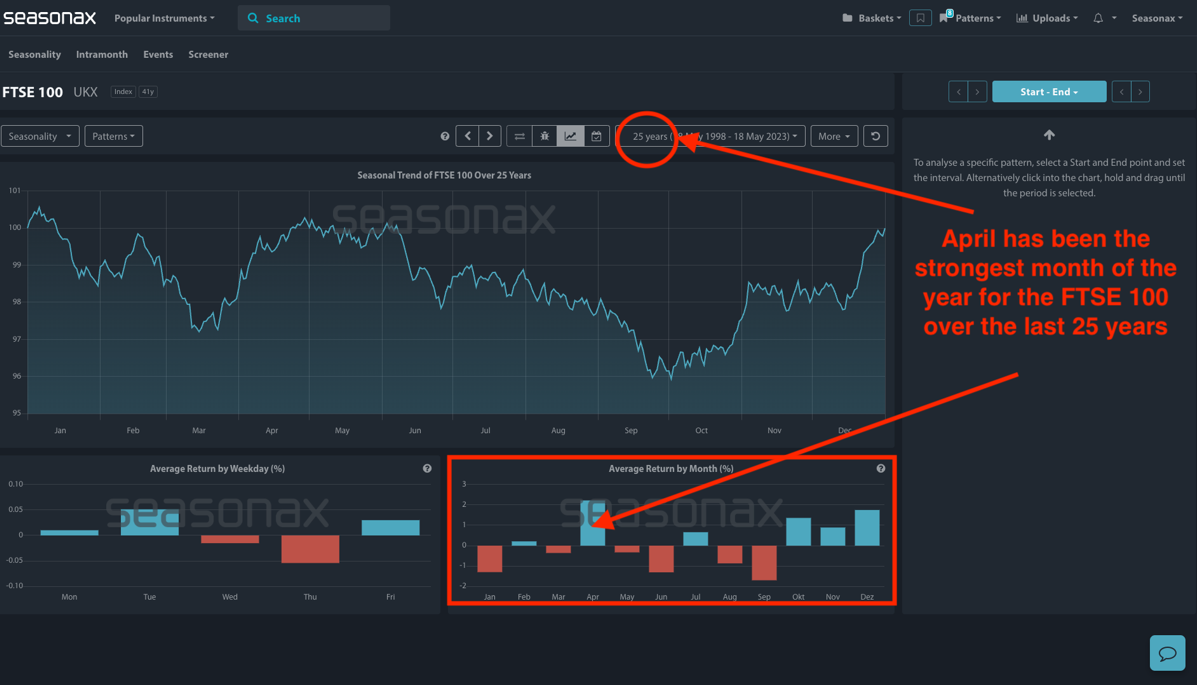
April: A Historically Bullish Month for the FTSE 100
The chart below shows you that in the last 25 years the month of April has been the month of strongest returns for the FTSE. You can see the average return by month in the box highlighted in red.
- Instrument: FTSE 100
- Average Pattern Move: +2.28%
- Timeframe: March 26 – April 30
- Winning Percentage: 76.00%
Drilling into the data more closely the next chart below you the typical performance of the FTSE 100 from March 26 to April 30 over the past 25 years. This period has historically delivered an annualized return of +26.30%, with a 76% win rate and an average return of 2.28% making it one of the most seasonally favorable times of the year for the index.
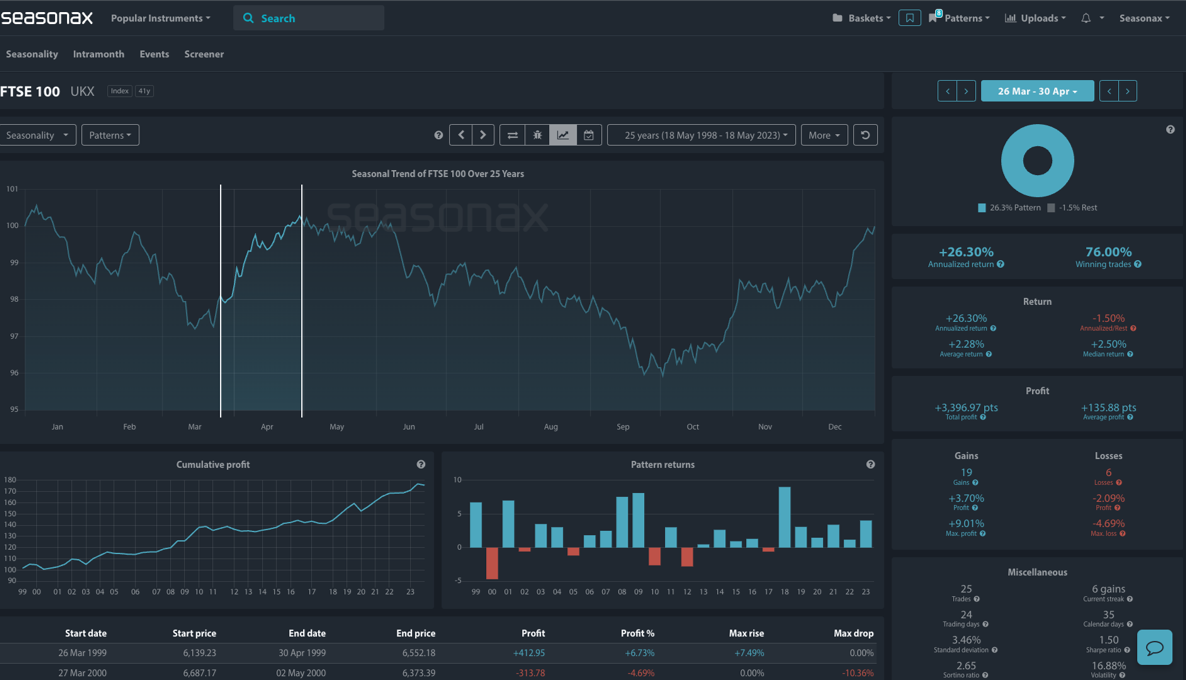
Several factors contribute to this strong seasonal performance:
- Earnings Season Momentum – April is a key month for corporate earnings, with FTSE 100 companies benefiting from a post-first-quarter earnings boost.
- Fiscal Year-End Flows – Many UK-based funds adjust portfolios at the end of the tax year in early April, often leading to a reallocation into equities.
- Dividend Reinvestment – The FTSE 100 is a high-dividend-yielding index, and April typically sees dividend reinvestment flows that support stock prices.
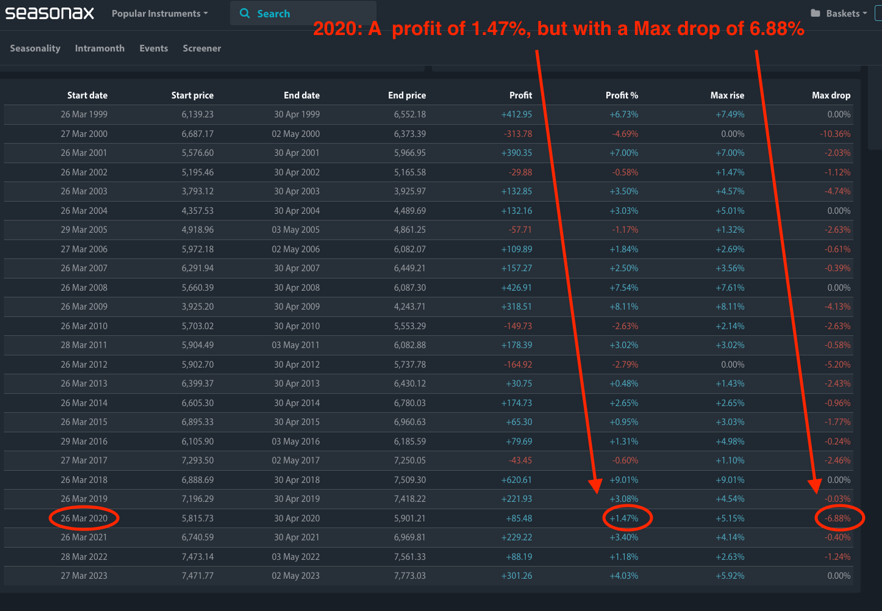
This historical backdrop suggests that even in a challenging fiscal environment, the FTSE 100 could still find seasonal strength. One final piece of data to consider is the maximum drop during a profitable year of that same pattern. You can see below that the largest drop during a profitable year has been 6.88%. This can be extremely helpful to see what sort of maximum stop losses could be used. It is helpful to know that intra-period falls of up to 6.88% have still been seen in profitable years.
UK Fiscal Policy and Market Implications
The Spring Statement is shaping up to be a significant market event. Chancellor Rachel Reeves is under pressure to stabilize public finances while adhering to her self-imposed fiscal rules. Preliminary forecasts from the Office for Budget Responsibility (OBR) indicate that the UK may miss key fiscal targets, prompting the need for spending reductions. Reeves has already instructed government departments to model budget cuts of up to 11%, with welfare spending and green investment likely to be impacted.
Additionally, any hawkish shift from the Bank of England in response to persistent inflation risks could weigh on the FTSE 100, particularly on rate-sensitive sectors. However, the seasonal pattern is strong and driven by other important factors and has a high historical win rate.
Use Seasonax for your professional handling of market-moving events!
Yours sincerely,
Giles Coghlan, CMT
Macro Strategist Seasonax