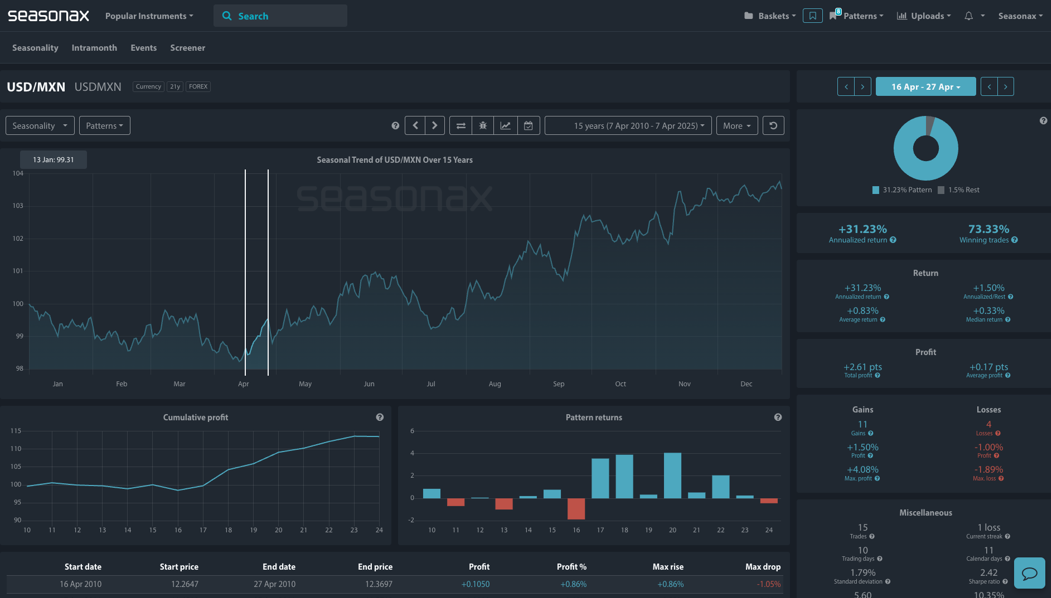
- Instrument: USD/MXN
- Average Pattern Move: +0.83%
- Timeframe: April 16 – April 27
- Winning Percentage: 73.33%
Dear Investor,
You may not realize it, but the Mexican peso has a habit of weakening against the US dollar during this time of year. With geopolitical risk flaring and the potential for the USD regaining momentum against the MXN, this is a good moment to explore whether history might be repeating itself. We want to analyze the data in more detail.
The chart shows you the typical development of USD/MXN between April 16 and April 27 over the past 15 years. This seasonal window has produced gains 73.33% of the time, delivering an annualized return of +31.23% and an average move of +0.83% over the 10-day stretch. The cumulative profit curve underscores the consistency of this trend.
Why Might USD/MXN Push Higher Now?
Mexico, given its deep trade ties with the US, is particularly exposed to shifts in tariff policy — and markets may price in further pressure on the peso should there be new unexpected developments. All of this combines to make this seasonal signal particularly timely.
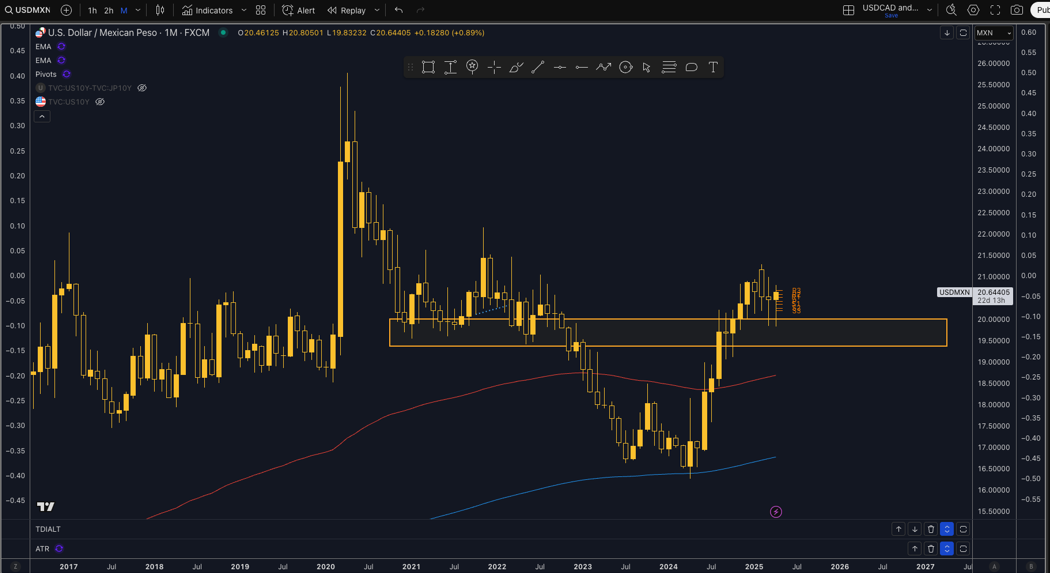
Technical Perspective
From a technical standpoint major monthly support sits at 20.00 marked on the chart below which will be an obvious place for stop placements.
Use Seasonax for your professional handling of market-moving events!
Sign up here for thousands more seasonal insights waiting to be revealed!
Trade Risks:
While seasonal tendencies favour USD strength, headline risks remain on new tariff headlines.
Don’t Just Trade It – Seasonax It!