Dear Investor,
You may have heard about copper’s sharp plunge over the start of April- a stunning reversal from the bullish euphoria sparked by looming US tariffs. The metal known as Dr. Copper, a classic gauge of global economic health, is now flashing recessionary warnings just as it heads into a historically weak seasonal window. Given this backdrop, we want to analyse the data in more detail.
Seasonal Headwinds Are Building
- Instrument: Copper (HG)
- Average Pattern Move: -4.19%
- Timeframe: April 27 – June 19
- Winning Percentage: 13.33%
The chart below shows you the typical development of copper prices between April 27 and June 19 over the past 15 years. The average loss for Copper has been -4.19% over this period and this marks one of the weakest seasonal periods for the metal. This consistent seasonal weakness is likely tied to post-winter construction lulls, a slowdown in industrial restocking, and reduced buying from China after the February activity surge.
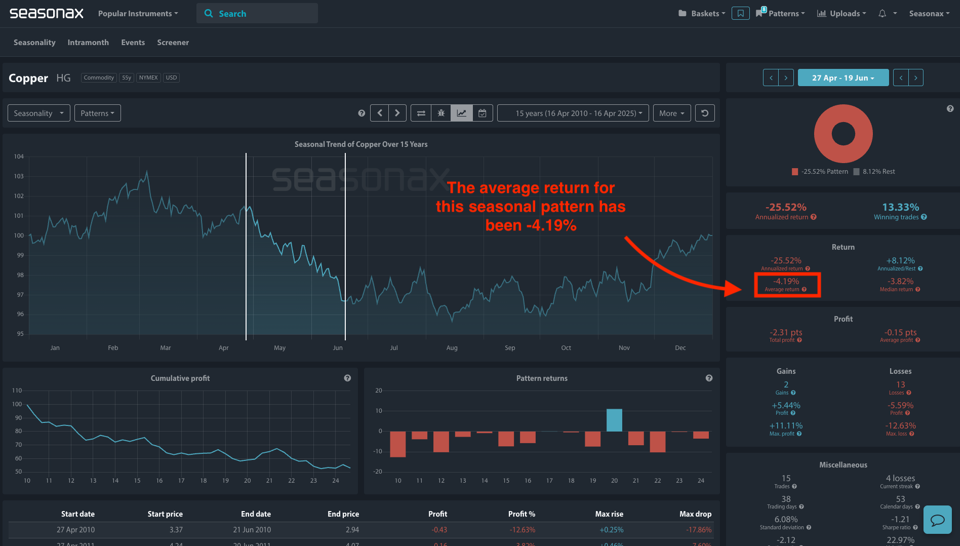
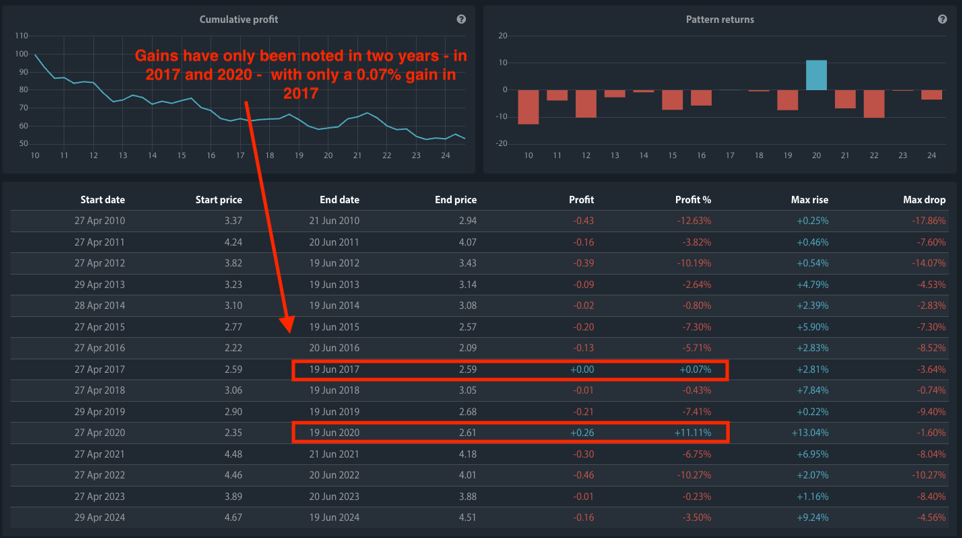
With an average annualised loss of -25.52% and a winning percentage of just 13.33% — this means copper has risen during this timeframe in only two out of fifteen years. See the highlighted boxes below for the two years of gains in 2017 and 2020.
From Boom to Bust in a Fortnight
Two weeks ago, copper futures hit record highs on Comex as traders rushed to front-run President Trump’s threatened 25% tariffs. Shipping flows surged, and premiums for US-bound cargoes spiked — in some cases as high as $500 per ton on top of future prices. Now, prices have collapsed in one of the sharpest three-day selloffs since 2008, with Comex copper dropping 10% from recent peaks at the start of April.
Why the reversal? Trump’s broader “reciprocal” tariffs are proving more disruptive than investors anticipated, triggering retaliatory measures from China and a violent repricing of demand expectations. JPMorgan now forecasts a US recession this year, and UBS warns Asian exporters could see output drop 2% for every 1% US GDP slowdown.
If Recession Hits, Watch Out Below
Copper’s slump aligns ominously with its seasonal pattern. This is no longer just a speculative unwind — it’s a reflection of real demand destruction. US manufacturers are already pulling back on spot orders, and traders report an almost total collapse in US-bound bidding activity.
Citigroup now expects non-US copper prices to average just $8,500 a ton in Q2, while Goldman Sachs sees risks skewed well below $9,000. If tariffs bite hard enough to tip the US into recession, prices could fall as low as $6,600 a ton, according to Chilean consultancy GEM — a near 25% downside from current levels.
Find Bearish Patterns with Seasonax!
As you can see, copper is currently showing signs of vulnerability. This seasonal phase of weakness could be further amplified this time by growing recession fears.
Use Seasonax for professional analysis of market-moving events, so you can identify strong seasonal opportunities at critical macroeconomic turning points ahead of time!
Yours sincerely,
Giles Coghlan, CMT
Macro Strategist Seasonax