Dear Investor,
Similar to many other market observers you may be expecting a seasonal rally in the crude oil price on account of the start of the heating season in autumn. After all, energy consumption will increase during the heating season in the Northern hemisphere.
However there are other, countervailing price drivers, such as use of other energy sources, economic cycles and prices which are often fixed in advance. What does the seasonality of crude oil really look like?
A seasonal downtrend in crude oil is starting from here!
To this end let us examine the actual seasonal pattern of the important crude oil benchmark grade West Texas Intermediate (WTI) as illustrated by a seasonal chart.
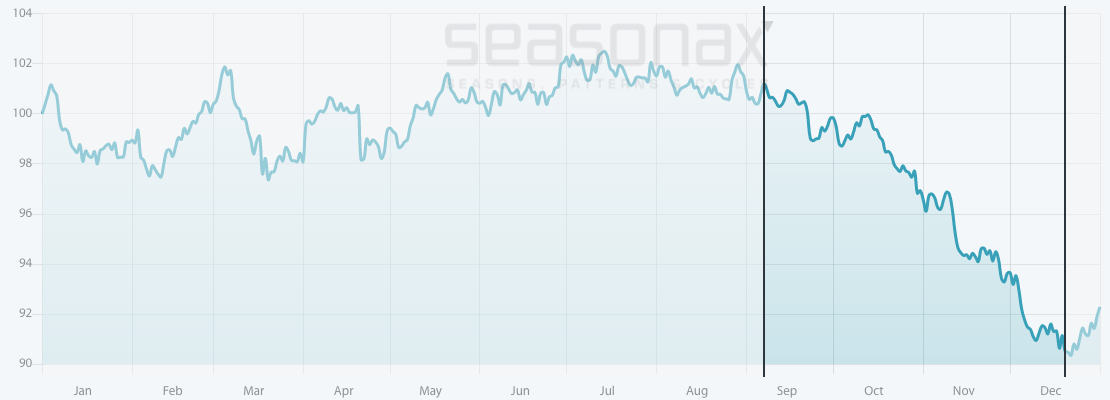
The following chart shows the average price pattern of crude oil in the course of a calendar year. The horizontal axis depicts the time of the year, the vertical axis the average price pattern over the past 20 years in percentage points. Thus the seasonal trends of crude oil can be discerned at a glance.
(Note: I have used a continuous futures contract (Bloomberg single commodity excess return index), since as an investor you are probably trading futures contracts (or other derivatives) rather than physical crude oil).
Crude oil, seasonal pattern over the past 20 years

Seasonal weakness in crude oil coincides with the heating season!
Source: Seasonax (click here to view the seasonal chart)
As can be seen, contrary to what most market observers probably expect, crude oil prices typically decline in the heating season! Sometimes expectations are not met – which is one more reason to always carefully review seasonal patterns.
Crude oil often slumps dramatically in autumn
I have highlighted the seasonally weak period on the chart in dark blue. It lasts from 07 September until 20 December.
The average loss posted by crude oil in this time period over the past 20 years amounted to 11.52 percent.
Crude oil declined in 11 out of 20 cases and rose in 9.
The following bar chart shows the return generated by crude oil during the seasonally weak phase from 07 September to 20 December for every single year from 2000 until today.
Crude oil, return in percent between 07 Sept. and 20 Dec., from 2000

Crude oil often declines significantly in the fall
Source: Seasonax (click here to view the seasonal chart)
Red bars represent years in which losses were posted in the autumn season. They predominate in frequency and extent.
This demonstrates that it was not a single statistical outlier that generated seasonal weakness on the seasonal chart. Rather, strong price declines have actually happened quite frequently in autumn.
There is indeed price weakness right in the middle of the heating season!
Seasonax provides all important seasonal data at a glance
The seasonal weakness of crude oil in autumn demonstrates vividly how important it is to perform a precise analysis of seasonal trends.
Today I also want to ask for your feedback regarding our product – help us to improve Seasonax, to make it a better product. Take part in our quick user survey and tell us which additional features you would like to get.
Yours sincerely,
Dimitri Speck
Founder and Head Analyst of Seasonax


