Dear Investor,
Have you been looking forward to the new Formula 1 season, which has just started? While the driver list has long since been completed, another racing team is already announcing its intention to add another competitor to this million-dollar spectacle for the new season.
If we take a closer look at the racing teams, we find a number of well-known car manufacturers. With the high costs for vehicles, drivers and developments being criticised every year, the racing teams never tire of quickly pointing out the research, the results of which sooner or later find their way into normal road vehicles.
When the races start, so does the season at the Mercedes circuit
Some of these manufacturers are also listed on the stock exchange, which is why it is worth taking a closer look at the corresponding movements over the course of the year. As an investor, you will certainly want to know how you can profit from these annual trends. Therefore, we will show you some of the parent companies of these racing teams based on the seasonal annual trends.
One well-known racing team is the Mercedes Benz Group.
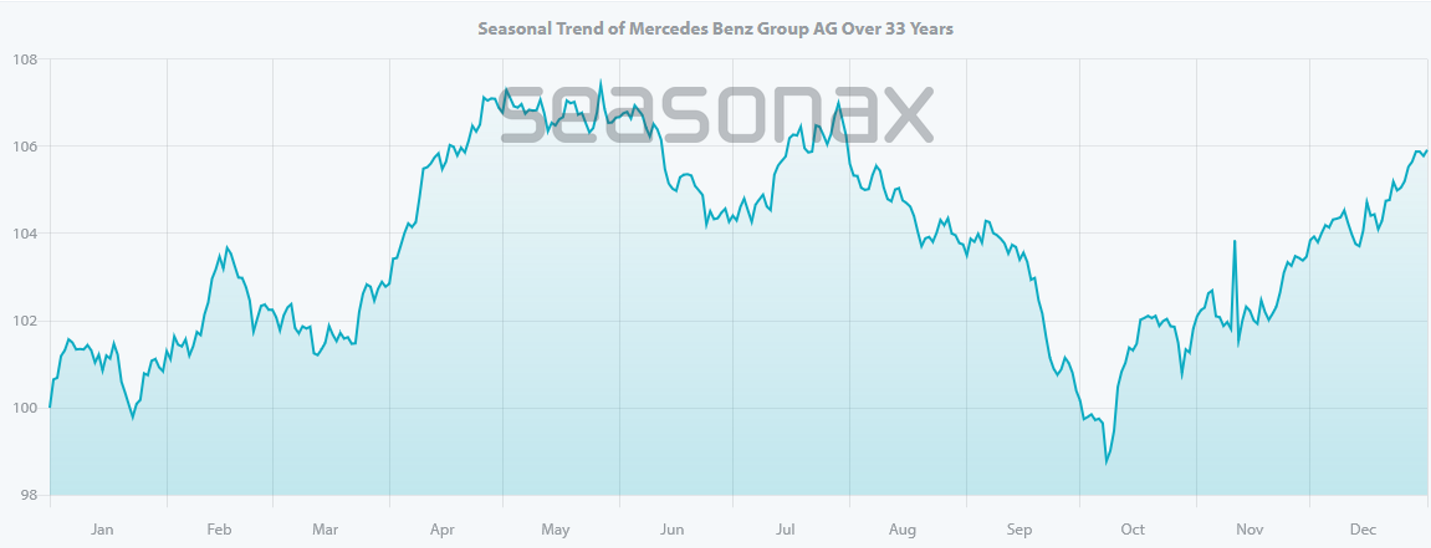
The chart shows three typical movements over the course of the year that you as an investor can take advantage of. Just in time for the start of the season in March, the German car manufacturer also gets off to a flying start.
From March 13 to April 26, a profit averaging a healthy 9% was achieved 25 times in the past 33 years. Only 8 years in this period were characterized by a manageable loss of 3.7 %. This data provides a good risk/reward ratio for a short-term trade.
The second conspicuous period begins at the end of July and ends on October 7. Here, a sell position was able to generate a profit 21 times, with a decent average return of 16%. But beware, as the 17 years in which there was no downward trend would have meant a loss of almost 10 % for the short investor.
Another outstandingly positive trend can be seen from the end of September to January 9. An average return of just under 15% was achieved in 25 years. Only 8 years closed with an average loss of 9% in this period.
With this share, it therefore makes sense to focus on the two periods in which profits can be made with long exposures.
Ferrari will also be sprinting from March
In a list like this, the attention grabbing name “Ferrari” should, of course, not be missing. The shares of the Italian luxury brand manufacturer, often referred to as “Scuderia” for short in Formula 1, have enjoyed a stable upward trend for years.
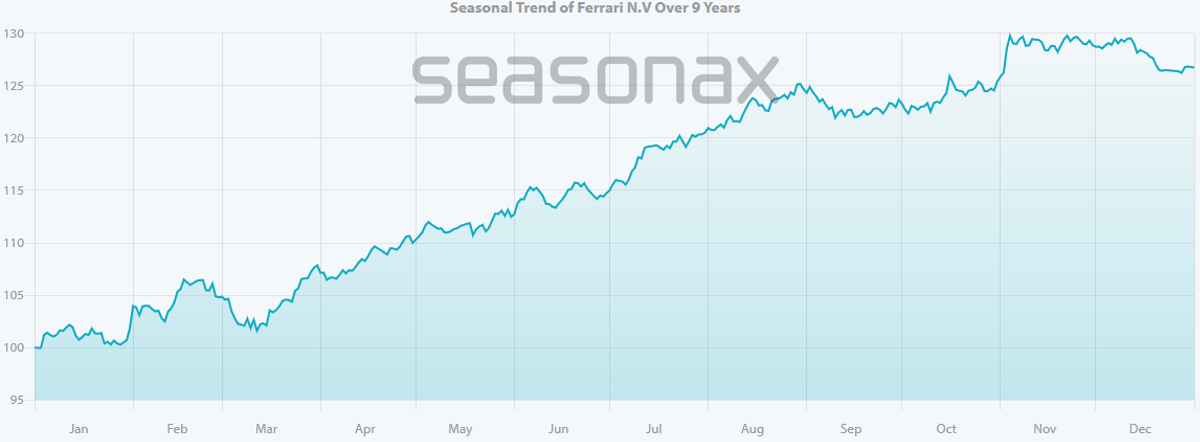
This is also reflected in the seasonal statistics. As with Mercedes, the Scuderia appears to be on the front row at the start of the season. It’s almost too good to be true that all previous years have ended with a profit in the period from mid-March to the end of August. Over the last 9 years, an average profit of over 22% has been achieved during this period. An impressive statistic, but one that should not be used carelessly. A stop must be put in place to prevent you from falling off the track at the first turn.
Williams can’t get going
Williams Grand Prix Holding is based in the United Kingdom and not only operates the racing team of the same name. In the seasonal chart, you can see that this share behaves completely differently to those previously presented.
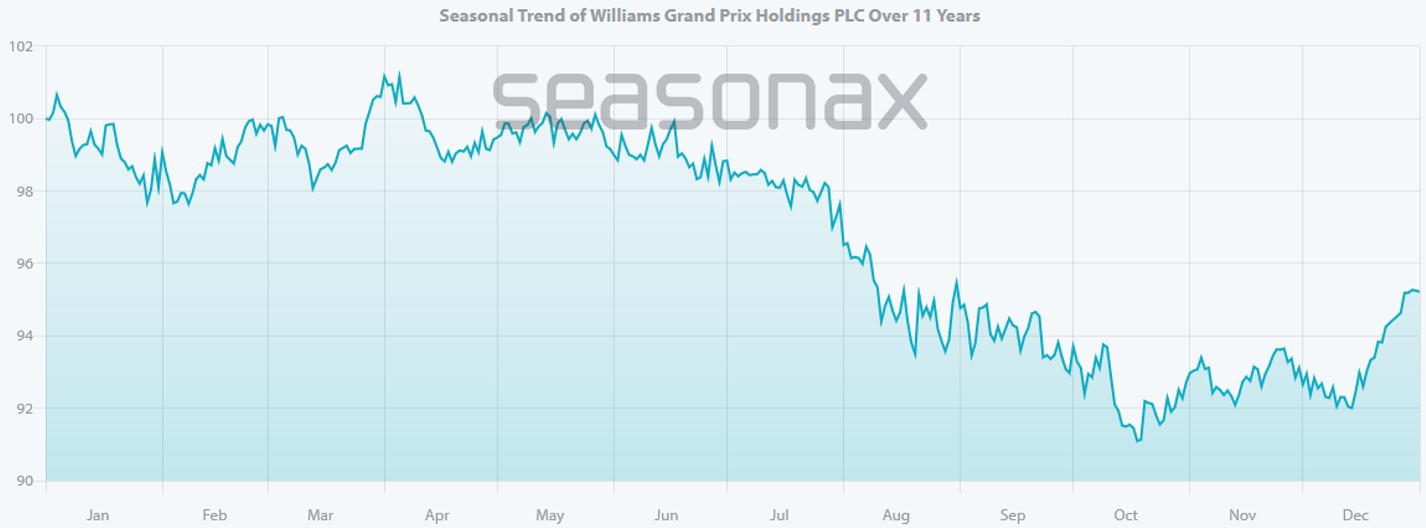
From the end of May, the Williams Grand Prix Holding share comes under pressure and generates an average loss of over 11% in 7 out of 9 years, which can be used for a short position.
Cadillac spurts in May
The General Motors brand Cadillac is not yet taking part this year but will certainly be an enrichment for the racing action from the 2026 season. If everything goes according to plan, this historic-sounding name will join the racing circuit next year.
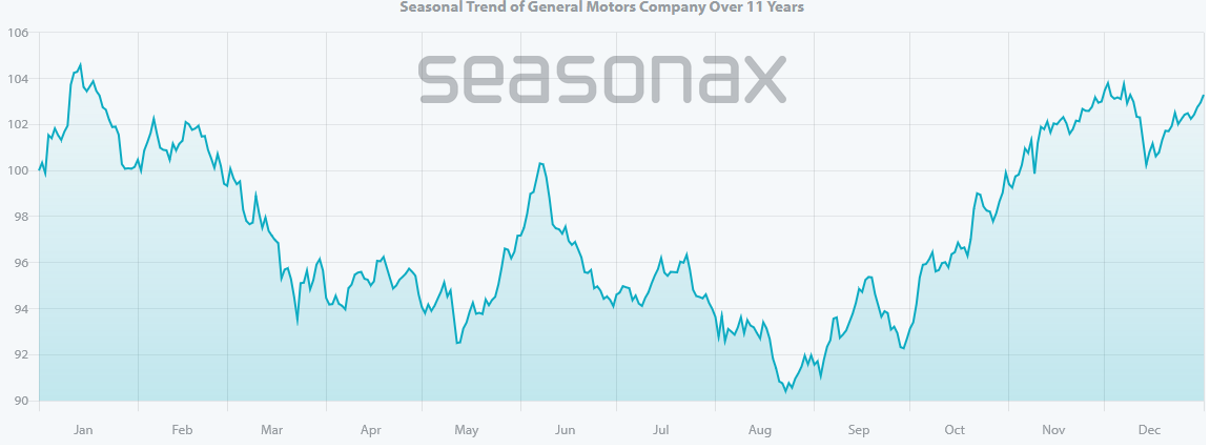
You should already take a closer look at the two significant movements in this share over the course of the year.
A short but intensive period starts on May 13 and ends on June 7. During this period, an average of over 10% was achieved in 9 out of 11 years. The two years in which a loss was generated are negligible with an average loss of just under 1.5%.
The second period that stands out at first glance is from the end of September to the end of November. Here, the impressive statistic of 10 to 1 with an average yield of over 14% is recorded.
Start the racing season with Seasonax!
Even if the valuation periods do not always have as great a history as that of Mercedes, it is striking that automotive shares always offer interesting opportunities for speculation over the course of the year.
Perhaps you will see this Formula 1 season with different eyes if you have bought or sold one of the other share with Seasonax charts and are now rooting for “your share” team.
In any case, we are keeping our fingers crossed that your investment has a start-to-finish victory.
Use Seasonax for your professional handling of seasonal trends!
Yours sincerely,
Christoph Geyer, CFTe
Winner of the AktienAnalystenAward Technical Analysis