Dear Investor,
One year later than expected, the UEFA Euro 2020(1) Championship has finally kicked off. The beginning of the traditional tournament dates back to 1960, and it has been held every four years since then. Many fans consider it to be THE sports event of the year.
Although 2020 has caught us off guard, we are looking forward to the brighter future to come. After lengthy lockdowns and stay-at-home measures, football stadiums will finally be filled with their natural inhabitants – football fans.
It is no secret that the football industry is a money-making machine due to all the business ventures it runs on the side. Apart from selling match tickets, the clubs are making money in segments ranging from broadcasting and sponsorship rights, retailing, merchandising, apparel and product licensing. At the same time the big sporting events also raise expectations and investor appetites for football-related stocks.
Scoring in the stock market
One of the clubs that is a master of all these activities and a top pick of investors is Borussia Dortmund. “The Black and Yellows” do not need a special introduction. Founded in 1909, the club has set major milestones over its “career” playing its home games in the 80,000-capacity Westphalia stadium (officially called Signal Iduna Park).
As in a football game, in the stock market timing is everything! To make the right moves and score in the stock market you should be aware of the strong seasonal phases of football stocks in the course of the year.
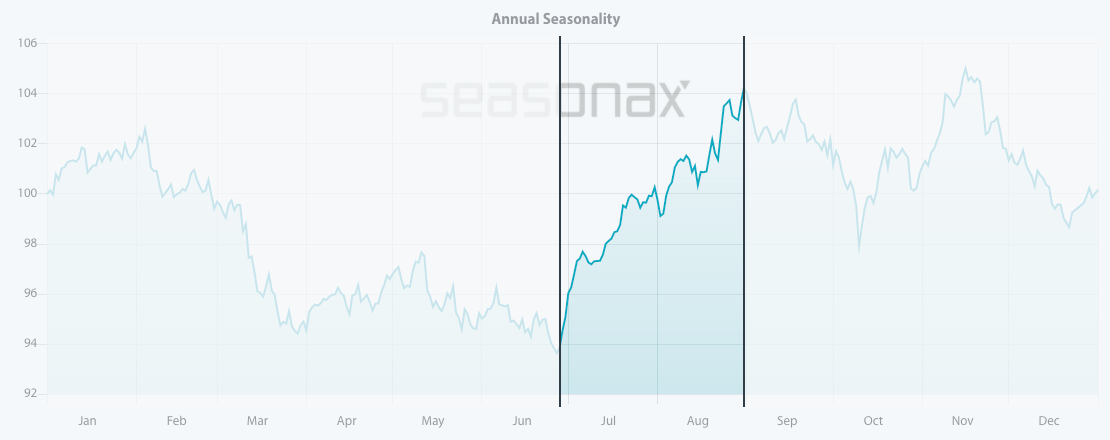
Borussia Dortmund stock typically generates strong gains in the summer months of the year. A detailed analysis and the period of seasonal strength can be seen in the seasonal chart below.
Before we dive deeper it should be noted that the seasonal chart shows the average price pattern of the stock calculated over the past several years. The horizontal axis shows the time of the year and the vertical axis shows the percentage changes in the value of the stock (indexed to 100).
Seasonal pattern of Borussia Dortmund over the past 15 years

Source: Seasonax – by clicking on the link you can conduct further analysis with the help of our interactive charts.
I have highlighted the strong seasonal phase from June 28 to August 31 (calculated over the past 15 years). On average Borussia Dortmund has delivered solid returns of 12.17% during this time period, which corresponds to a very respectable annualized gain of 96.76%.
Further analysis reveals the frequency of positive returns during this phase. The bar chart below depicts the return posted by Borussia Dortmund in the relevant time period from June 28 to August 31 in every year since 2006. Blue bars indicate years with positive returns and red bars indicate negative returns.
Pattern return for every year since 2006

Source: Seasonax – click on the link to conduct further analysis
In the past 15 years, 2020 was the only year that did not generate gains for investors during July and August. Lockdowns and COVID-19 restrictions have played a major role in this, as they weighed on the valuation of the stock. However, excluding 2020, the returns have been quite stable and consistent, which is testament to the stability and reliability of this seasonal pattern.
While there is no guarantee in the markets that a pattern will recur, seasonal charts help you to be aware of these special anomalies during the year and provide you with a statistically sound edge for your investment strategy.
There is one more club that shows a strong seasonal trend over the summer months. Nicknamed Vecchia Signora (“the Old Lady”), Juventus Football Club has brought a lot of joy to its fans as the record title-holder in Italian soccer competitions.
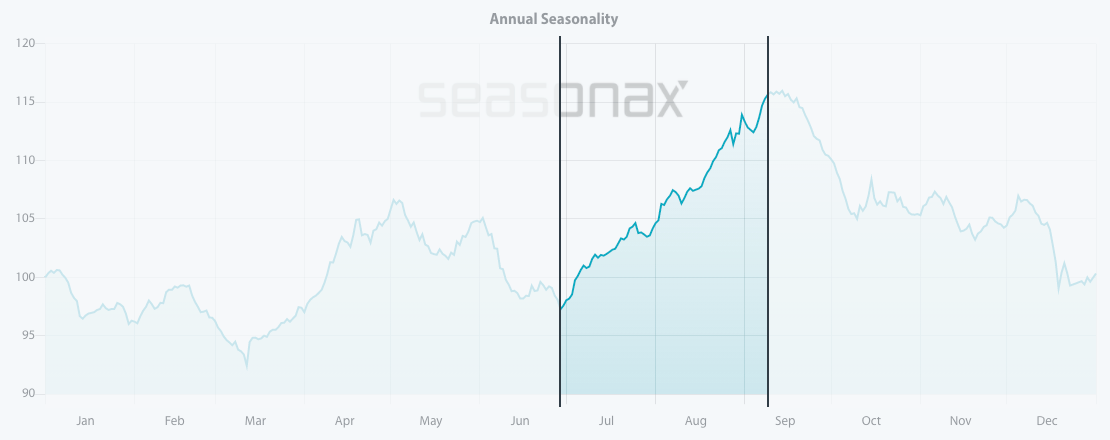
Looking at its stock, historically Juventus Torino also exhibits a strong seasonal phase during the third quarter of the year.
Seasonal pattern of Juventus Torino over the past 15 years

Source: Seasonax – by clicking on the link you can conduct further analysis with the help of our interactive charts.
During the highlighted time period from June 29 until September 9 the stock of Juventus Turin generated an average return of 18.07 percent, scoring winning trades in 80% of the cases over the past 15 years.
It is also interesting to examine the average monthly moves over the past 15 years, which point to strong seasonal returns during summer months as well.
Juventus Torino Average Monthly Returns over the past 15 years

Source: Seasonax
Whether the easing of the pandemic will bring back a strong summer season this year will be revealed shortly.
Enter the world of seasonal opportunities
In addition to these two giants there are several other football clubs sporting market capitalizations in the billions of dollars. Many of them are listed on different stock exchanges, such as Manchester United or Ajax.
Apart from football clubs there are also many other stocks that are benefiting from seasonal effects related to big sports events, including Nike, Anheuser Busch InBev or PepsiCo.
To make finding these opportunities even easier, we have launched a Seasonality Screener. The screener is an analytical tool designed to identify trading opportunities with above-average profit potential starting from a specific date. The algorithms behind the screener are based on predictable seasonal patterns that recur almost every calendar year.
Feel free to analyze more than 20.000+ instruments including stocks, (crypto)currencies, commodities, indexes by signing up for a free trial.
Yours sincerely,
Tea Muratovic
Co-Founder and Managing Partner of Seasonax

