Dear Investor,
When you are pondering seasonality, commodities or stock market indexes are probably the first things that come to mind. Perhaps you consider single stocks or currencies in this context as well.
However, seasonal patterns can also be detected in a quite young trading instrument that is best known for its spectacular price gains: Bitcoin.
Today I want to examine the seasonality of Bitcoin in detail for you.
The seasonality of Bitcoin under the magnifying glass
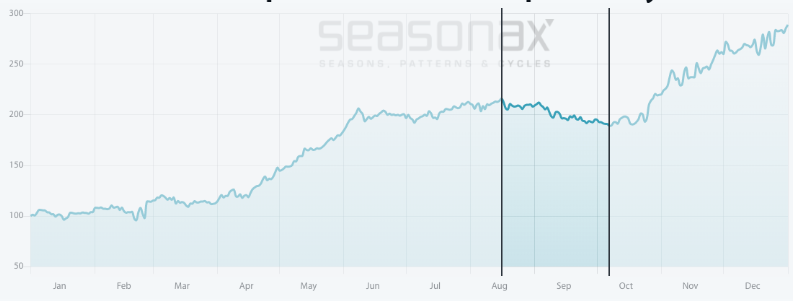
To this end, let us take a look at the seasonal pattern of Bitcoin according to its annual seasonal chart.
This seasonal chart depicts the average pattern of Bitcoin in the course of a calendar year. The horizontal axis shows the time of the year, the vertical axis the level of the seasonal index. This way one can discern the seasonal pattern at a glance.
Bitcoin, seasonal pattern over the past 10 years

Seasonal weakness tends to develop from mid-August onward
Source: Seasonax (click here to view the seasonal chart)
As can be seen, most of the time Bitcoin is either rallying or moving sideways. However, there is also a period of weakness: it begins on August 16 and ends on October 07. On average, Bitcoin lost 13.64% over these two months. I have highlighted this weak seasonal phase on the chart.
Detrending brings seasonal trends into stronger relief
Alas, when it comes to an asset such as Bitcoin, which has risen relentlessly in recent years, “weakness” is a relative concept.
In view of its high volatility, even a sideways move can entail risks you may want to avoid.
Seasonax has a function that can assist you in such cases, called “detrending”. 
Detrending means that the overarching uptrend is removed from the calculation of the seasonal pattern. This makes it immediately clear when the relatively weak phases take place. The next chart shows the detrended seasonal pattern of Bitcoin.
Bitcoin, detrended seasonal pattern over the past 10 years
Seasonally weak periods can now be discerned quite well
Source: Seasonax (click here to view the seasonal chart)
As you can see, detrending brings seasonal trends into stark relief. Thus periods of seasonal weakness can be discerned quickly and more easily.
You will for instance notice that relative seasonal weakness in Bitcoin actually started already in June. Prices were still rising slightly in absolute terms, but at a below-average pace relative to Bitcoin’s usual moves.
The main phase of seasonal weakness nevertheless begins on August 16. As mentioned above, from that date onward prices on average tended to decline by 13.64 percent in about two months.
Take advantage of the detrending function!
With the help of detrending you can fairly quickly identify periods of relative seasonal weakness in instruments that have rallied strongly and persistently in recent years. Such phases can potentially be of interest for the purpose of minimizing risk by reducing exposure or even for the purpose of entering short positions.
Webinar “How You Can Benefit from Little Known Seasonal and Cyclical Patterns”
I recently had the honor to give a webinar hosted by the CMT Association as part of their Educational Web Series. It is available now on our YouTube channel – watch it now!
Yours sincerely,
Dimitri Speck
Founder and Head Analyst of Seasonax


