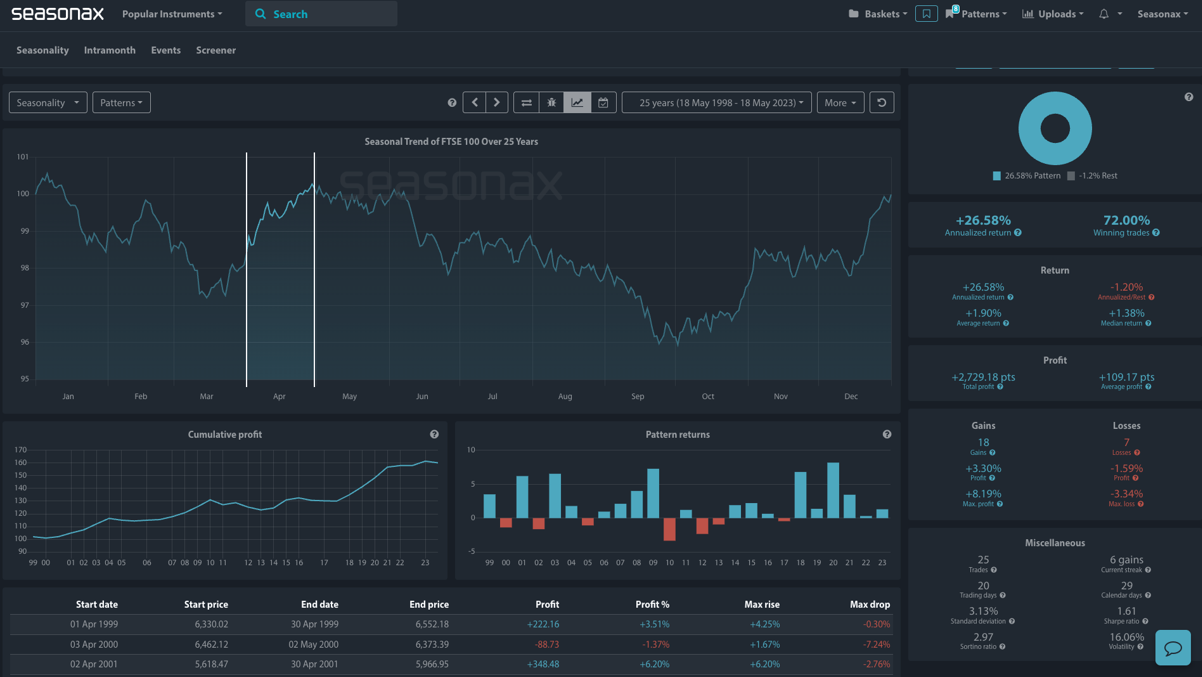
- Instrument: FTSE 100
- Average Pattern Move: +1.90%
- Timeframe: 1 Apr – 30 Apr
- Winning Percentage: 72.00%
Dear Investor,
You may have heard of the ‘turn-of-the-month’ effect in equity markets — but did you know that the FTSE 100 has one of the strongest April patterns among global indices? With fresh capital allocations for the new tax year as well as portfolio rebalancing, and institutional inflows often converging at the start of a new month, the UK benchmark frequently benefits from a strong seasonal boost. We want to analyse the data in more detail.
April Momentum: A Reliable Springboard for the FTSE 100
The chart shows you the typical development of the FTSE 100 during the month of April, using data over the past 25 years. The pattern is striking — the index has generated an annualised return of +26.58% over this period, with gains occurring in 72% of those years.
The average return over the month stands at +1.90%, with the cumulative profit curve showing a steady climb — a testament to the persistence of this pattern. The early part of April has tended to deliver the bulk of the upside, coinciding with common institutional flows and dividend reinvestment activity.

Why This Happens: Several factors likely contribute to this recurring trend:
- Paycheck effect: As salaries are disbursed at month-end, retail investors often allocate fresh capital in early April.
- Fund flows: Mutual funds and pension managers tend to rebalance and deploy new assets at the start of the month.
- Dividends & options: April sees a cluster of dividend declarations and expiries, influencing hedging activity and cash deployment.
The UK tax year-end on April 5 plays a significant role in reinforcing the FTSE 100’s early April strength.
- ISA and Pension Contributions: In the final days of the tax year, UK investors often rush to maximise their annual allowances for ISAs and pensions. This creates a surge in capital inflows, typically hitting markets in the first trading days of April.
All of this combines to create a favourable environment for stocks, and the FTSE 100 — spanning top-tier names in energy, banking, and consumer staples — is well-positioned to benefit from such flows.

Technical Perspective
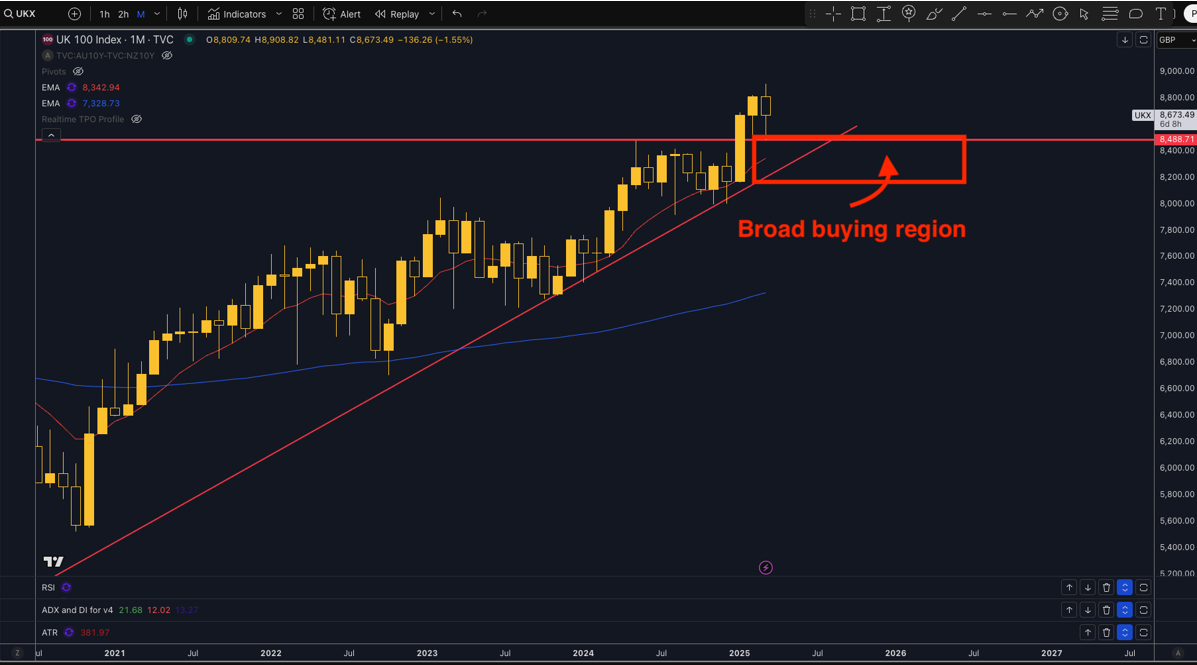
From a technical standpoint the FTSE 100 is in a steady uptrend on the Monthly chart holding above it’s 100 and 200EMA. The key buy zone for this uptrend sits in a broad range between 8,500 and 8,300.
Use Seasonax for your professional handling of market-moving events!
Sign up here for thousands more seasonal insights waiting to be revealed!
Trade Risks
As always, seasonal tendencies are not guarantees. The biggest trade risk is that prior trends do not necessarily repeat year after year. There is also concerns that UK growth is tepid and the broader impact of US trade tariffs is far from clear yet.
Don’t Just Trade It – Seasonax It!


