Dear Investor,
In order to beat the market, you are probably – like many investors – spending a lot of time searching for rare undiscovered gems or sophisticated trading rules.
There is actually a simpler way.
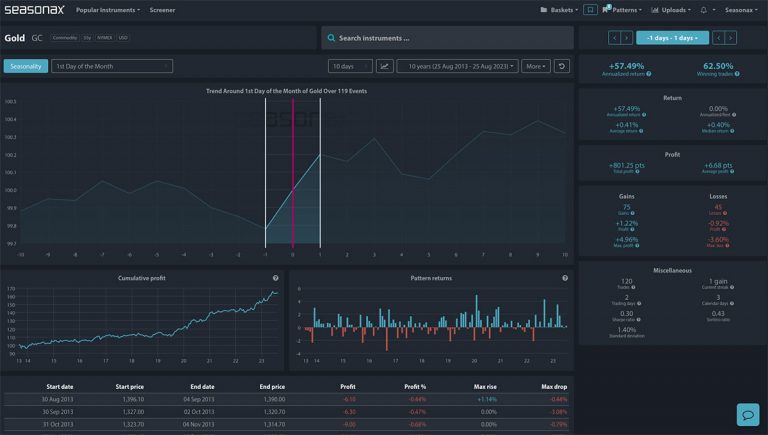
I want to show you how you could have beaten the market over approximately the past 90 years – with only two trades per month, while being invested only one third of the time and without employing any kind of leverage.
Gains are Only Generated Around the Turn of the Month!
Take a look at the following chart. It shows the capital gains delivered by the S&P 500 Index since 1928, depending on the days of the month in which a position was held.
The blue curve shows the cumulative return generated by the index between the 26th of every month and the 5th of the subsequent month. The red “curve” – which actually looks suspiciously like the x-axis – shows the return generated by the index during the rest of the time, i.e. between the 6thand the 25th of every month.
Cumulative return of the S&P 500 Index around the turn of the month (blue line) and the rest of the time (red), indexed (100), 1928 to 2017

Gains are actually only generated around the turn of the month. Source: Seasonax
As can be seen, the time period around the turn of the month outperformed the rest of the time rather handily. The average gain achieved during the profitable time period was 7.60 percent, while in the rest of the time an average loss of -1.86 percent was recorded!
The phenomenon is aptly named the “turn-of-the-month effect”. It is tied to payment streams around the end of the month, such as salary payments and pension plan contributions.
The calculation also shows that calendar-related effects can remain stable and profitable for a great many years. Take advantage of them!


