Article in German
Dear Investor,
Event Studies provide a completely new way to improve your investment strategies.
As a Seasonax user you can benefit from these new Event Studies.
Business users have free access to all events. If you are not a business user yet, just upgrade to use the full Seasonax feature set!
Let me show you an example of how you can profit from event studies when trading and investing.
FED meetings boost the stock market!
I would like to go back to the example you are familiar with, and which I already presented four weeks ago: the Fed meeting. This takes place eight times a year, and sets monetary policy along with the level of key interest rates.
While most investors are watching spellbound for the central bankers’ decision, a statistically relevant price movement is taking place in the run-up.
How you can create an event chart yourself
To create this event chart, first select the S&P 500 in Seasonax. Click on “Events” at the top left of the chart, and then select the event “FED Meeting (second day)” from the dropdown menu to the right.
The following event chart appears. It shows you the mean trend of the S&P 500 in the ten trading days before and after the second day of the FED meeting, when the interest rate decision will be announced. The red line in the middle marks this second day of the FED meeting.
Average performance of the S&P 500 ten trading days before and after the second day of the FED meeting (2013 to 2023)
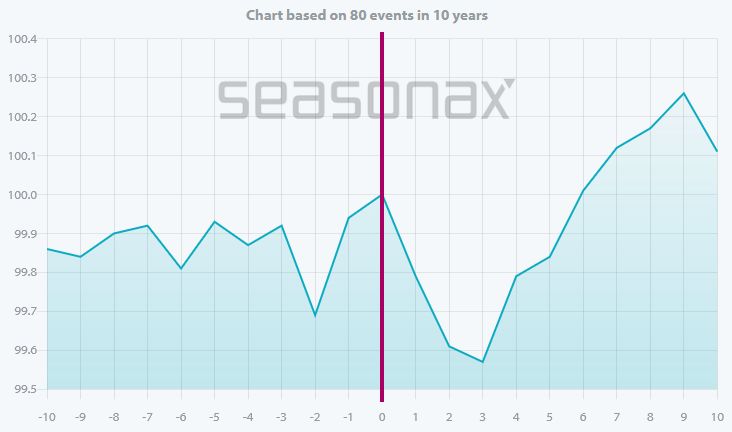
In the two days before, the S&P 500 rises particularly strongly. Source: Seasonax
A glance at the event chart will tell you what the typical course of U.S. stock prices looks like around the important central bank meeting.
Noticeably, stock prices were already rising in the run-up to the announcement of the outcome of the FED meeting. After that, there was a slowdown.
With two mouse clicks you have the result
You can now observe a pattern, as in the seasonal analysis, by marking the interesting phase with the mouse. We decide on the two days before – in just these 16 trading days a year, a larger profit was achieved in the past 25 years than in the remaining 240 or so trading days of the year!
To mark the tradable pattern, click the mouse in the chart at the point marked with the green arrow, hold the mouse button, drag it to the red arrow and release there:
Average performance of the S&P 500 ten trading days before and after the second day of the FED meeting (2013 to 2023)
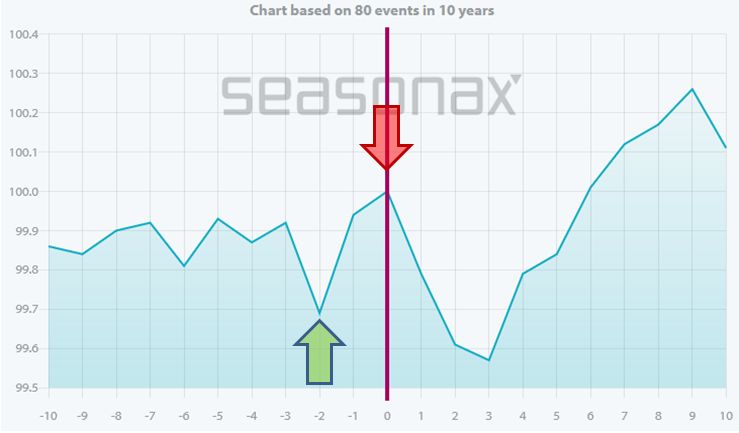
The pattern is quickly marked. Source: Seasonax
The evaluation of the pattern appears immediately with the key figures and evaluation diagrams, as you know from the seasonal analysis:
Seasonax screen, detail, with event study
The result will appear immediately. Source: Seasonax
On the right you can see the evaluation with important key figures such as the annualized return or the hit rate (“winning trades”). Below you will find other diagrams and detailed statistics.
For example, look at the capital yield curve (“cumulative profit”):
Capital return curve of the event “two days to the FED meeting”
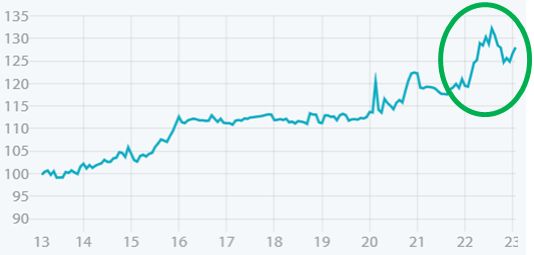
The yield trend was very good in 2022. Source: Seasonax
It illustrates the earnings trend. There was an increase from 2013 to 2016, then a sideways movement, and then again an increase.
Particularly noteworthy: the year 2022, which was disastrous for most investors, also saw a significant increase (green circle).
What I personally find very positive is the stability of the pattern. It has been profitable since the mid-1980s. Moreover, it was prominently published in a scientific journal in 2011. So there have certainly been many hedge funds and other investors who have arbitraged it. Yet it still works!
Nearly 100 events at Seasonax mean millions of event studies
This is only one event study out of many, which you can determine with just a few mouse clicks. At Seasonax, you can choose from almost 100 events covering a wide range of areas, from reports such as the CPI or labor market data, to futures expiration days such as the witches’ Sabbath and calendar events.
You can combine these events with any instruments – indices, stocks, currencies or commodities. This results in several million event studies in mathematical terms.
Thus, there should be events on most days of the year that have proven significant in the past.
How investors can use event studies
Event studies can be used by investors in the same way as seasonality. However, most event studies are short-term in nature. Very few events last for weeks or months. Nevertheless, it is not only traders who can use event studies:
- You can trade events directly, one after the other or several at a time. The direct approach is suitable especially for short-term traders.
- Traders can also use the trends of the events as a filter. In this case, the trader does not take a position against the pattern, with the intention of increasing the probability of return of a trade.
- Investors can use an event study for timing purposes and, for example, bring forward a planned purchase. This also results in an additional benefit of the event study for long-term investors.
- Investors can use events as an additional input to their existing approach. The previous strategies can thus continue to be used.
Let me emphasize again: the event studies are an additional offer of Seasonax free of charge for our customers! Of course, you can and should continue to use seasonality, but you can open up further opportunities with event studies.
Why not try out an event study at www.seasonax.com right now!
Warm regards,
Dimitri Speck
Founder and Chief Analyst of Seasonax
PS: Seasonax: seasonality and event studies!
