As we approach Nvidia Corp.’s highly anticipated earnings report (Wednesday Aug 28), market watchers are bracing for another standout performance. The consensus among analysts points to a significant beat, with expectations running so high that it is thought Nvidia may raise its profit outlook for the coming months.
Nvidia has emerged as a key player in the ongoing AI boom, reaping the rewards of massive investments from companies racing to build AI-driven infrastructure. This growth story is likely to continue influencing other tech giants like HP Inc. and Dell Technologies Inc., which are also due to report earnings soon. However, Nvidia’s seasonal pattern is one to watch this week.
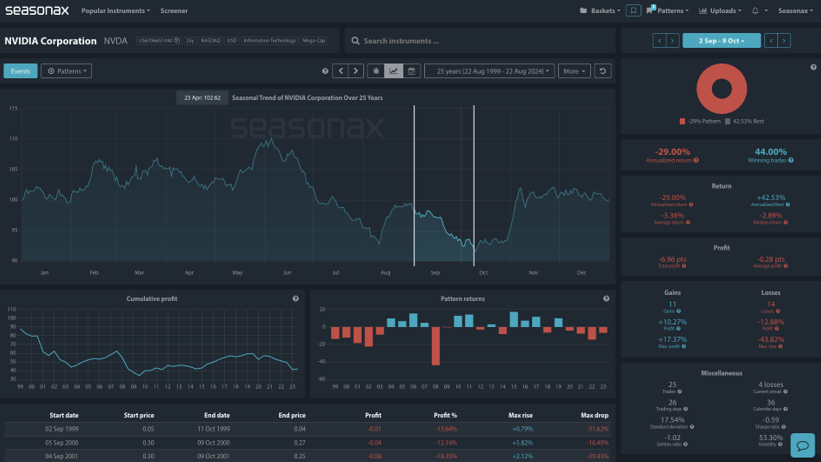
The seasonal analysis of Nvidia’s stock displayed in the chart highlights a historically weak performance during the period between September 2nd and October 9th. Over the last 25 years, this window shows a consistent negative pattern. The cumulative profit graph reveals that Nvidia typically faces significant downward pressure during this stretch, with a total loss of -6.96 points over the observed years. The average loss is -3.36%, with a median return of -2.89%. Historically, losses outweigh gains, as reflected by a higher number of losing trades (14) compared to winning trades (11).This pattern could serve as a warning of potential short-term downside risks.
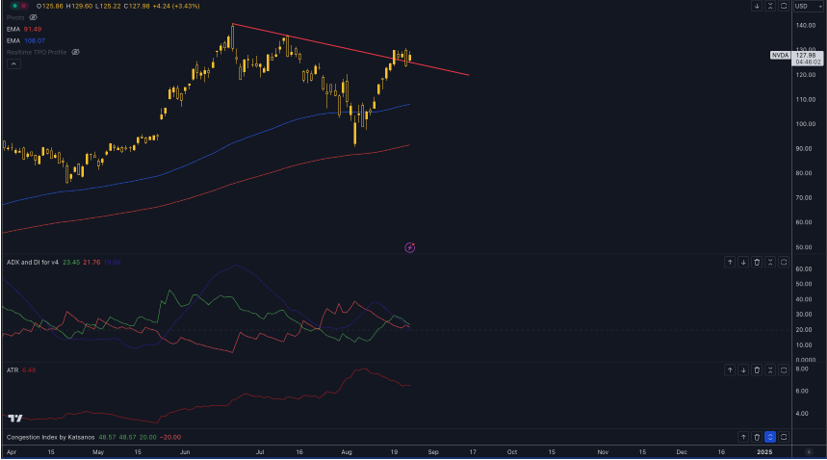
Technically price is hovering around a key trend line on the daily chart and this could prove a pivotal level around earnings next week. If earnings disappoint then expect sellers on a break of the trending and a move down back toward 95.00
Sign up here for thousands of more seasonal insights just waiting to be revealed!
Trade risks
There have also been periods of gain during certain years, so remember that seasonal patterns do not always repeat themselves each year.
Remember, don’t just trade it Seasonax It!