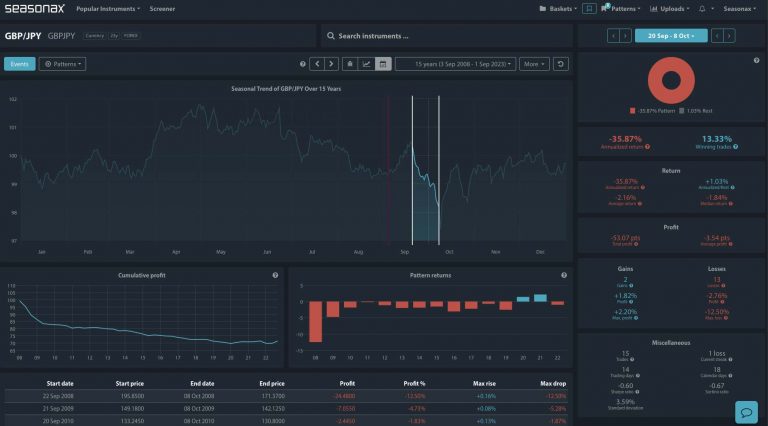
As we approach the next Federal Reserve meeting the seasonal data suggests a typical pattern where stocks tend to rally leading into the Fed’s second meeting day but often decline afterward. The S&P 500 has experienced losses during this specific time window, with an annualized return of -53.14%, and 45% of the trades post-Fed have resulted in losses, underscoring a bearish bias.
Leading up to the Fed meeting, the S&P 500 tends to see slight gains as traders position themselves ahead of policy announcements. However, following the Fed’s decision, markets often exhibit downward pressure. This trend suggests that investors take profits or react to the news, especially when the Fed’s communication leans more cautious than anticipated.
A major factor driving potential post-Fed declines is the Fed’s signal regarding the future path of interest rates. If the Federal Reserve, led by Chair Jerome Powell, signals a slower or more gradual pace of rate cuts than currently expected, it could disappoint markets and weigh on stocks.
What Could Happen if the Fed Signals a Slower Path For Coming Cuts?
Should Powell’s messaging suggest fewer rate cuts than market expectations, we could expect a deeper selloff in the S&P 500. The historical pattern shows that the S&P 500 could experience declines as deep as -4.67% in extreme cases. In the past, maximum losses have reached -2.25% on average, but with volatility at 22.64%, markets could see more pronounced moves, particularly if the Fed’s tone diverges from current market expectations.
In summary, while the S&P 500 may see gains heading into the Fed meeting, traders should be prepared for potential declines post-announcement. The magnitude of these declines will largely depend on how the Fed communicates its future rate path. A slower pace than expected could trigger a selloff, with losses potentially reaching levels seen in historical post-Fed declines.
S&P 500 Technical Analysis
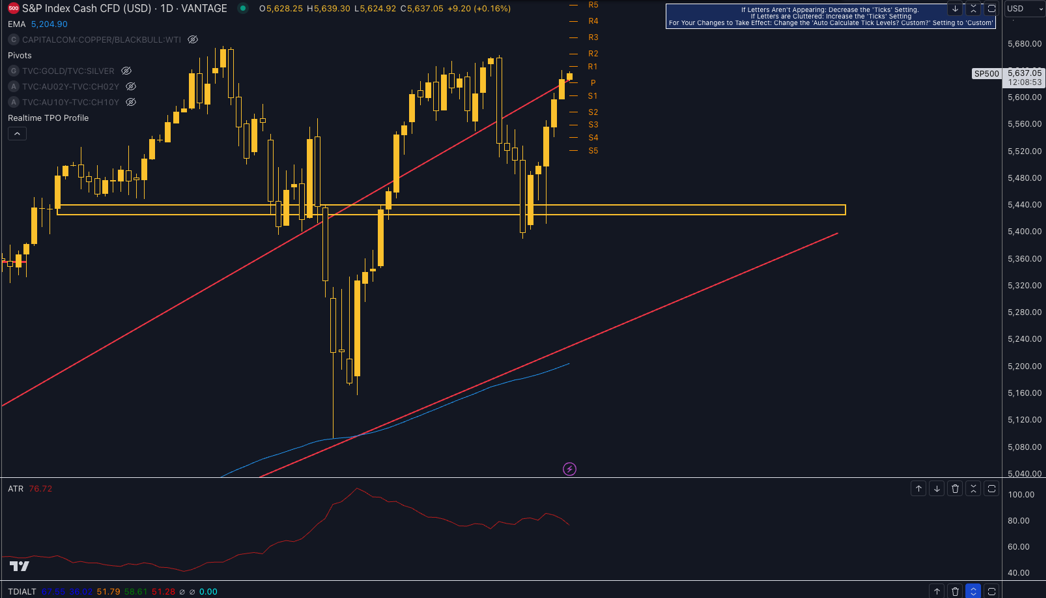
The S&P 500 chart reflects a well-defined uptrend, with the price holding above key technical levels. The price has recently bounced off a horizontal support zone (highlighted in yellow), which has acted as a critical level multiple times. This area around 5,440 has provided a firm floor, and the subsequent rally has taken the price towards the resistance level near R1. There is an upward sloping red trendline which has held throughout the rally. The price has consistently respected this line, and as long as it remains above, the bullish trend should continue. The ATR currently stands at 76.72, indicating that volatility is moderate. This could suggest that while the market may see steady moves, sharp breakouts or breakdowns are less likely in the immediate future unless catalyzed by external news or events. Be mindful of a potential decline in the S&P 500 following the Fed’s announcement, especially if the central bank signals a more cautious approach to interest rates than anticipated as flagged by the seasonal pattern.
Sign up here for thousands of more seasonal insights just waiting to be revealed!
Trade risks
- As with all seasonality-based analysis, past patterns may not always repeat. Unexpected geopolitical developments or major economic data could also impact the market’s reaction to the Fed’s decision.
Remember, don’t just trade it Seasonax It!