Why do Seasonal Patterns Matter for Your Portfolio?
Because they repeat with surprising accuracy.
What is a seasonal chart?
Seasonal Analysis searches for predicable patterns of human behavior that occur repeatedly. We use this information in the financial markets to add a high-probability edge to our trading.
Check out a couple examples below!
Drag the line to compare the seasonal chart to a stacked chart view
About to take a trade on precious metals?
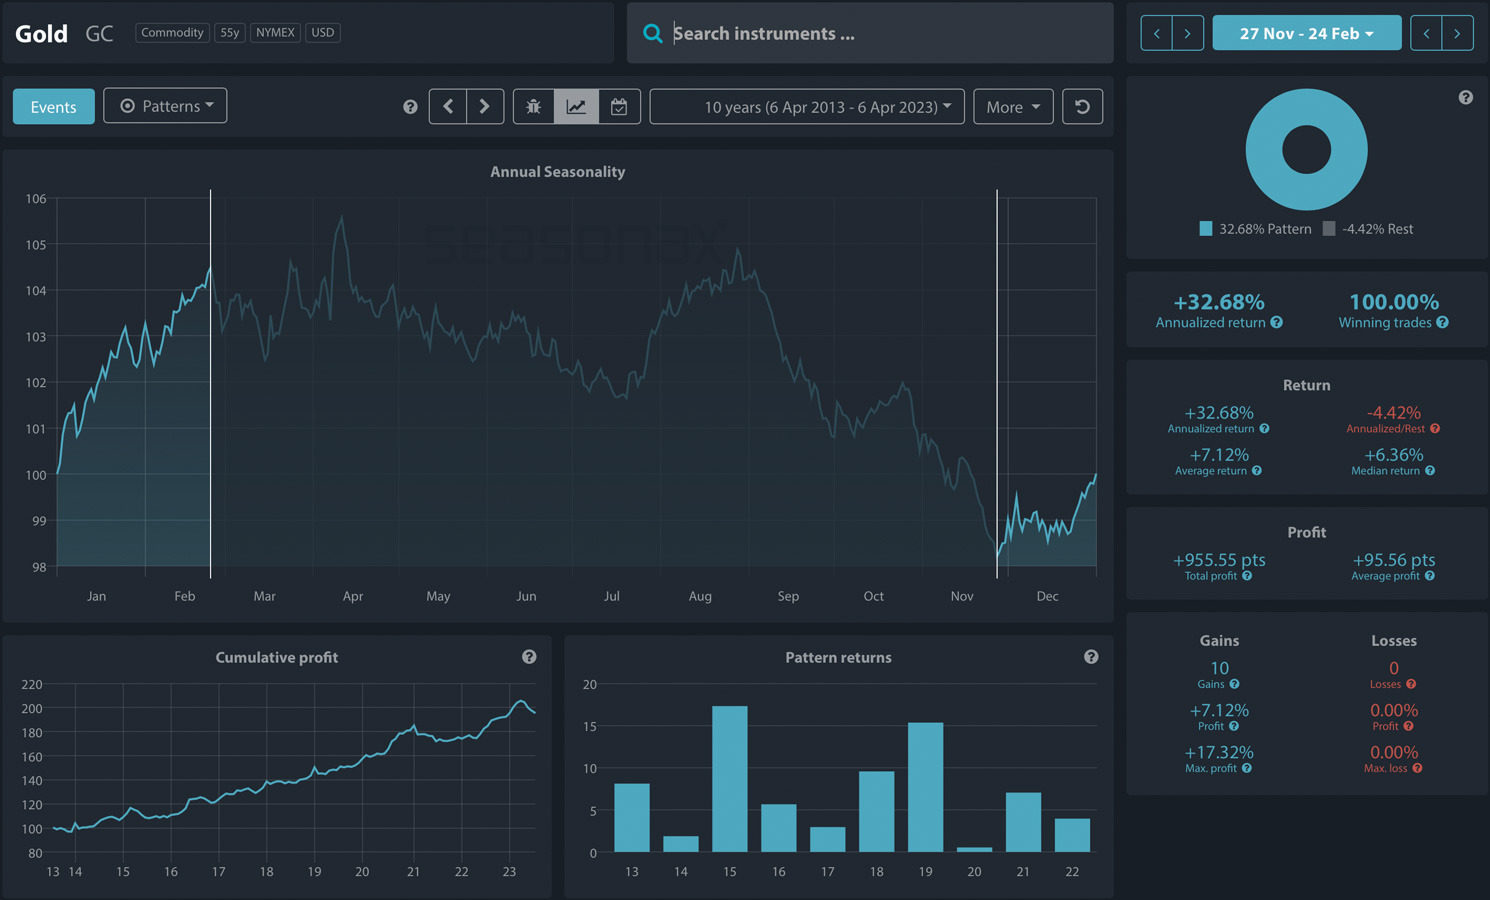
- Selling gold in January or February? Think again! Gold has appreciated 100% of the time over the last ten years over that period.
- Looking to sell platinum between January 3rd and February 6th? Platinum increases in value 86% in that time frame over the past 15 years

Considering a buying opportunity on your favorite stock?
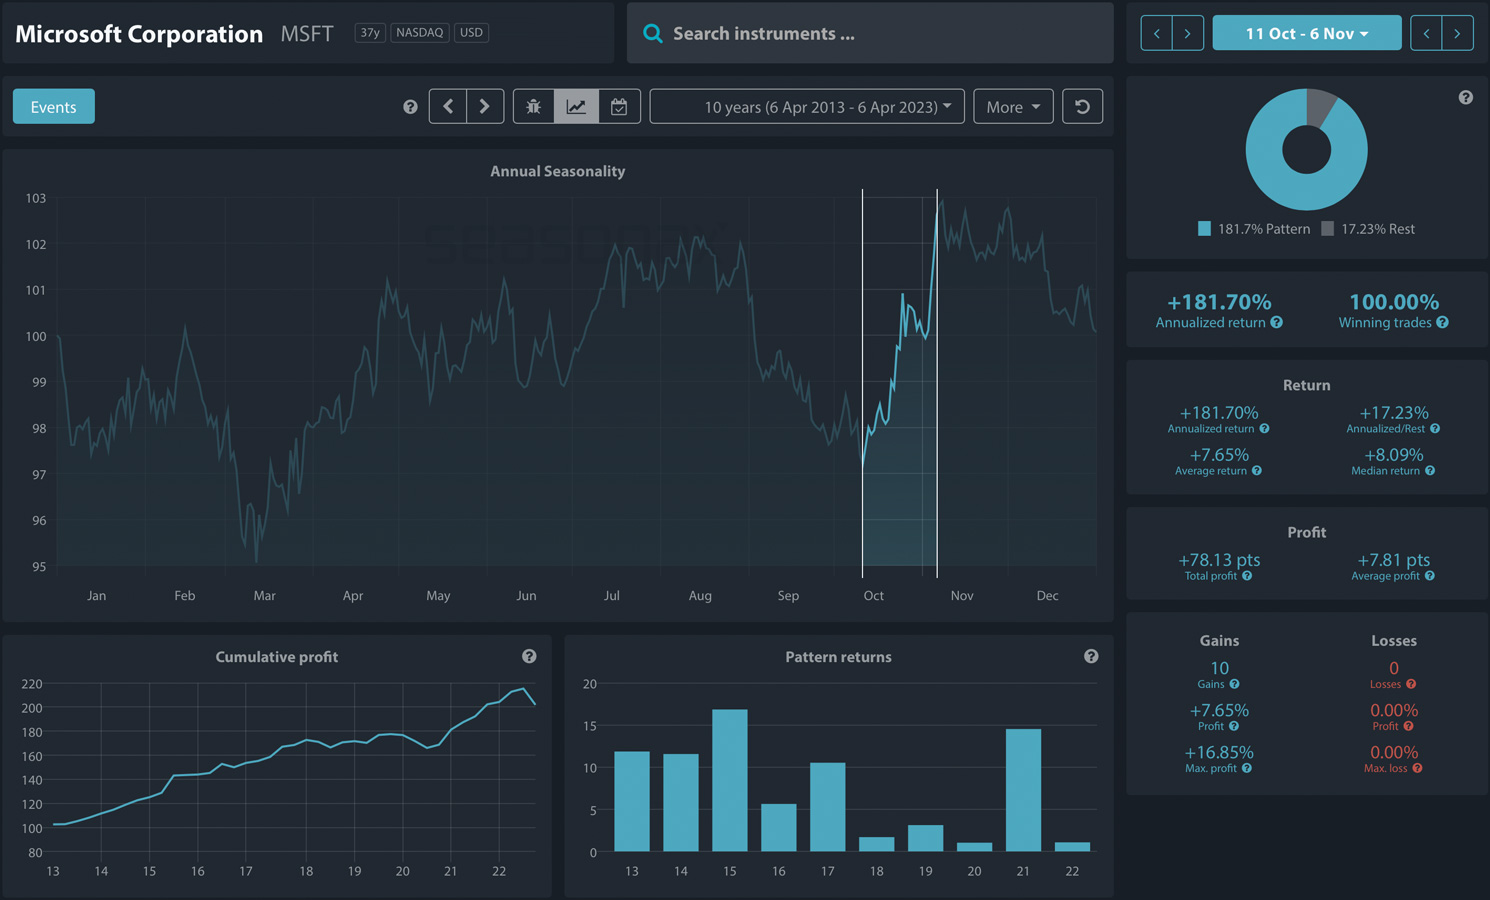
- Buying Microsoft in the Autumn? Check Seasonax! MSFT rose 100% of the time over the past ten years in October with a 181.70% annualized return.
- Sell in May and go Away? Not for Tesla. Between May and July, Tesla stock rose with a whopping 216.30% annualized return over the past 10 years.

Do seasonal patterns also work for my commodity portfolio?
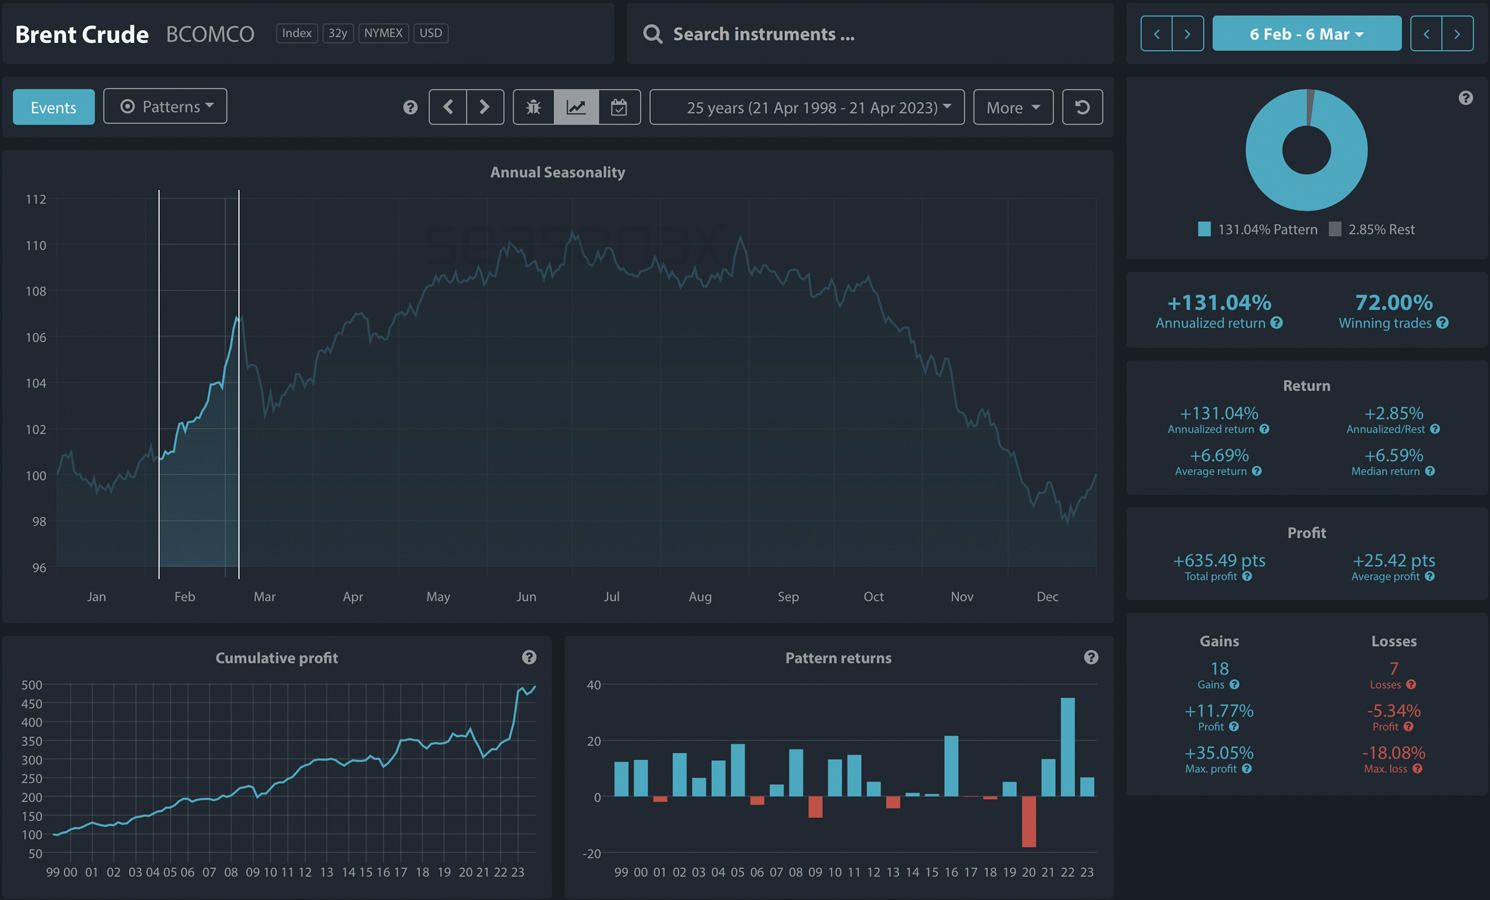
- Do the fundamentals and technicals tell you to sell oil in February? Not so fast. Between February 6th and March 6th oil has risen 72% of the time over the past 25 years
- Buying Soybeans when the market opens after the new year? Good choice! Soybeans rose 70% of the time after the new year for the past ten years.


What does the data say?
Evidence from a 200+ year meta-analysis
Researchers from Erasmus University in Rotterdam have examined several investment strategies in 68 individual markets over up to 217 years of market history and concluded: Seasonality is the Best Investment Strategy!
How You can Benefit from little known seasonal and cyclical patterns
Dive deeper into the world of seasonality and watch the latest CMT webinar featuring our Head Analyst and Co-Founder Dimitri Speck
