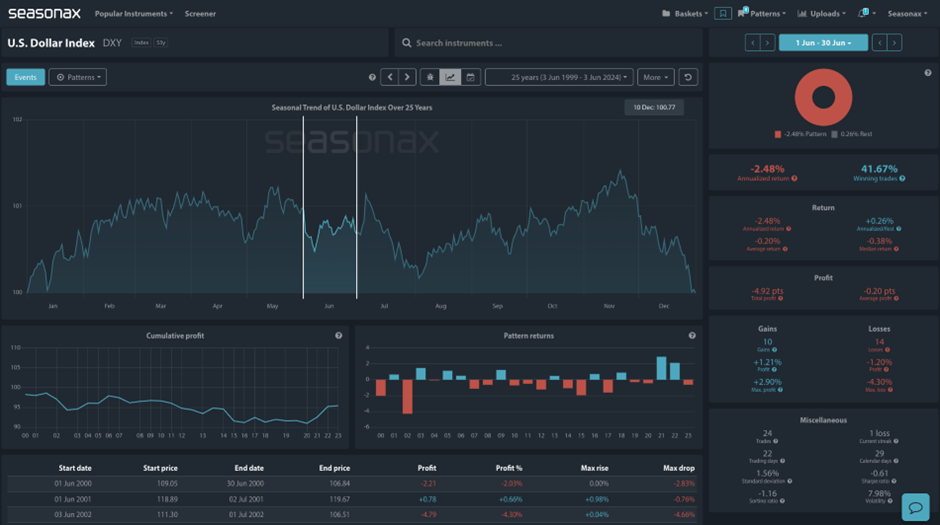
The DXY has a period of seasonal weakness ahead and the recent inflation data out of the US has been supportive for those looking for dollar weakness. The latest US PCE print came in fractionally lower than expectations for the month over month reading at 0.2% vs 0.3% expected. Crucially, signs of US inflation spiraling quickly out of control failed to materialise and that has allowed the dollar to fall back through its daily trend line (see below). The Prices Paid component of the ISM on Monday came in lower than expected at 57, below the minimum expected of 57.8. So, the weaker seasonal pattern for the DXY is of particular interest. The seasonal focus has two distinct months. Firstly, the month of June. This month has a nearly 60% losing bias for the USD and an average return of -0.20%.
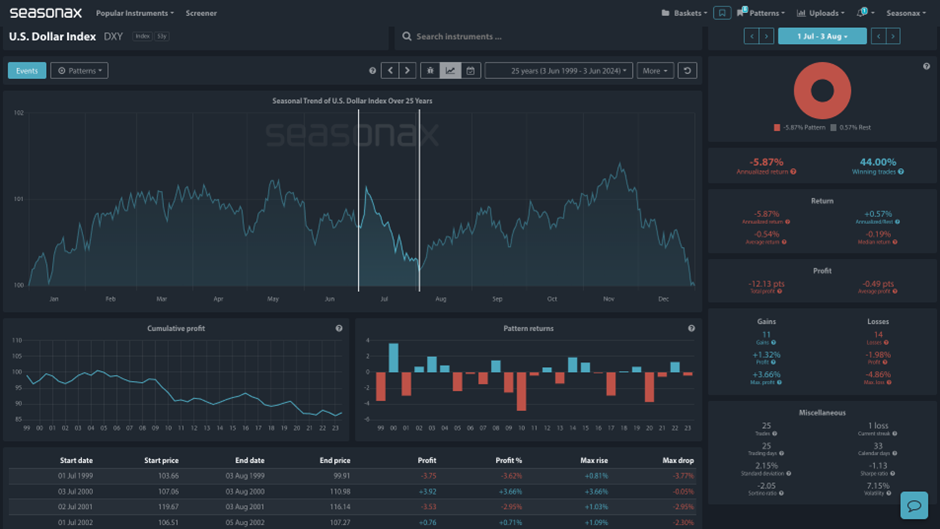
The next pattern, from July 01 through to Aug 03, sees a similar bias for USD selling, but average falls of 0.54%. So, there is a seasonal bias for further USD selling and this could be encouraged if we start to see weakness in the US labour market on Friday’s NFP print.
Technically, there is major potential trend line on the weekly chart from May 2021 and January 2024 lows which is sitting around 1.50% lower than current prices of 104.13.
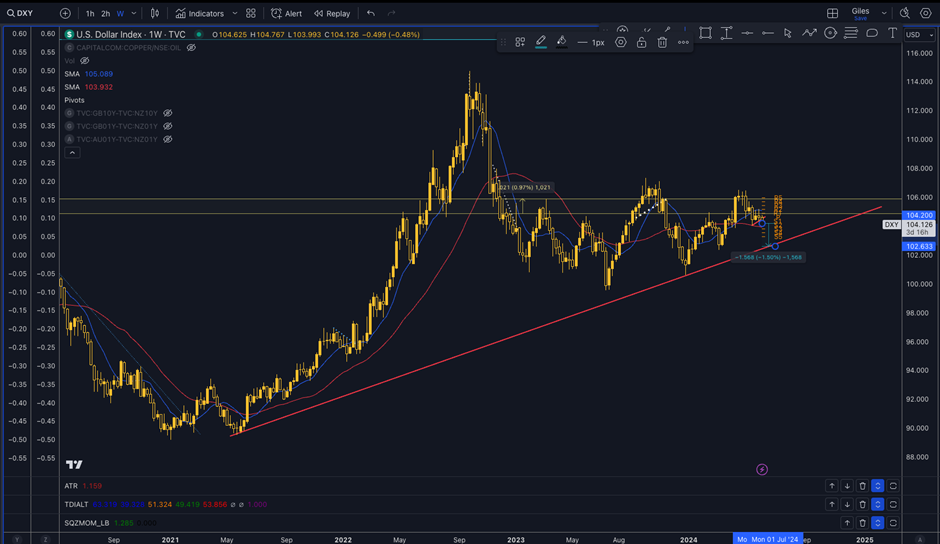
This could provide a target for any USD sellers.
Sign up here for thousands of more seasonal insights just waiting to be revealed! https://app.seasonax.com/signup
The major trade risk here is to be aware that the path of the USD is closely linked to US inflation data and US labour data.
Remember, don’t just trade it Seasonax It!