
Dimitri Speck Founder of Seasonax Dimitri Speck is a trading system developer and financial analyst. He has received several international awards for his investment strategies. Speck is also the author of the book titled “The Greatest Financial Bubble of All Time.”
He has spoken at the conferences of both international umbrella organizations of Technical Analysis, including in New York alongside Williams, Bollinger, and Prechter.
On www.seasonax.com, Speck offers interested investors the opportunity to conduct analyses in the areas of seasonality, cycles, and event studies without programming knowledge.
How You Can Systematically Increase Your Profits with Seasonality
The Classic Seasonality Has Been Working for Decades
You probably know the saying: “Sell in May and go away,” which can be freely translated as “Sell in May and stay away from the stock market.” It is probably the most well-known seasonal stock market adage, perhaps even one of the most famous market sayings in general. The phenomenon of the weak summer months is also known as the “Halloween Effect,” which additionally considers reentry after six months.
Source: Seasonax
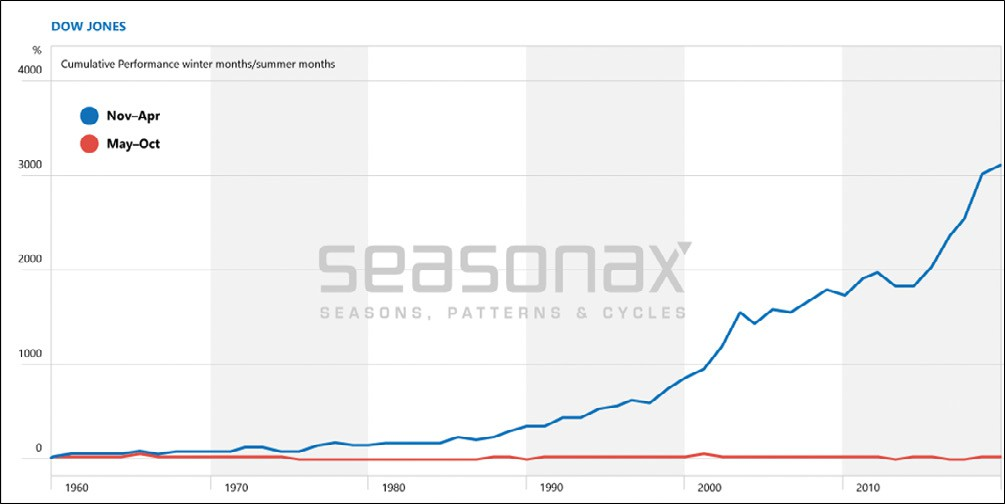
The chart illustrates what following this rule would have yielded in the past 60 years. In red, you see the return of a Dow Jones investment in percentage from May to October, i.e., during the summer half-year or by ignoring the rule. For comparison, you see in blue the return of an investment from November to April, during the winter half-year.
Practically the entire performance over these 60 years was achieved in the seasonally good months of the winter half-year. During the seasonally weak months from May onwards, investors could have stayed away from the market altogether.
The Autumn Rally: High Performance in a short time
You see that a seasonal correlation can be stable for a very long time. Of course, there are exception years. Additionally, seasonal trends can change. However, no correlation and no trading rule on the stock exchange is always valid. Ultimately, it is about operating with probabilities – and this is where seasonality can make an important contribution.
Source: Seasonax
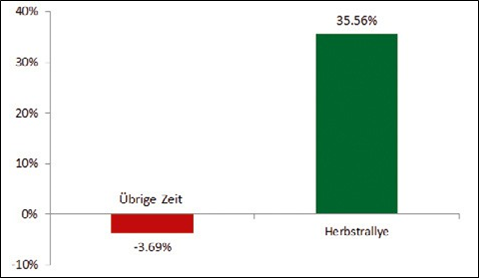
Another well-known example of seasonality in the financial markets is the autumn rally. Look at this in the example of the German DAX. The bar chart shows you in green the average performance of the DAX over the past 25 years during the autumn rally from October 9 to January 4. For comparison, the performance during the rest of the year is shown in red. Since the autumn rally, with an average length of 87 calendar days, is shorter than the rest of the time with 278 calendar days, the results have been annualized for better comparability.
Unlimited possibilities with seasonality and cycles!
Most investors have probably heard of the two seasonal patterns shown – the Sell-in-May pattern and the autumn rally. However, there are many more seasonal and cyclical investment opportunities – and what only a few investors know will help you the most. Firstly, there are seasonal trends in other values as well. These include:
- Indices
- Stocks
- Currencies
- Commodities
- Bonds
Moreover, there are not only annual cycles but also other calendar-based cycles. Regular but occurring on different days of the year events complement the topic:
- Four-year election cycle
- Annual seasonality
- Monthly cycle
- Weekly cycle
- Intraday cycle
- Recurring events
Common seasonal patterns like the Halloween Effect refer to indices. But do you want to stay away from the markets for the whole summer half-year just because it performs below average? Probably not. This shows the limits of the utility of the widely known seasonal patterns among investors.
There are always seasonally promising investments
It’s fortunate that individual stocks have their own seasonal trends. These result, for example, from internal company or industry-specific reasons. The large number of stocks enables investors to make seasonally promising investments at any time of the year. Furthermore, they can proceed in a diversified manner to reduce risks. Instead of saying goodbye to the stock markets in the weak season, the investor can invest in seasonally promising stocks. Even more opportunities arise from cycles of other lengths, such as the monthly or weekly cycle, as well as from event studies. Events are understood as events from the fields of economic figures, holidays, or central banking that systematically impact prices.
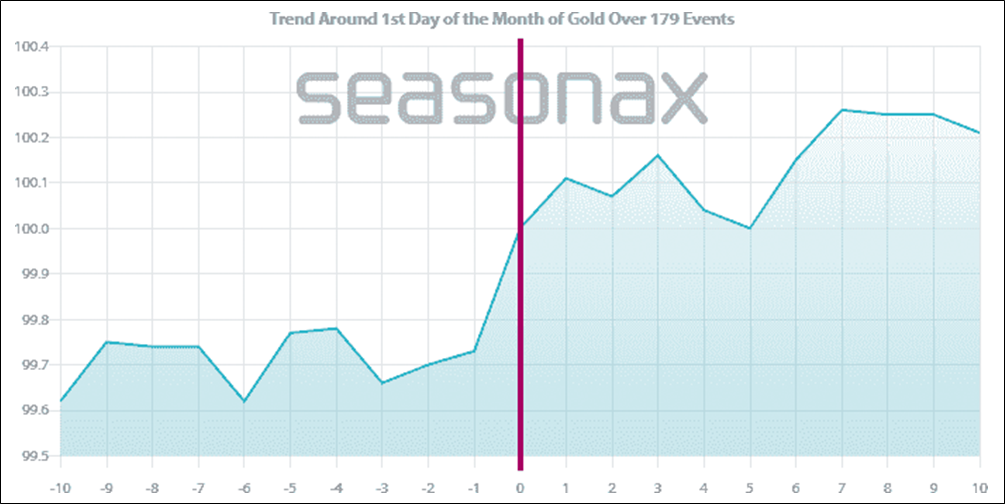
Have you ever wondered how much the S&P 500 rises at the important meeting of the US Federal Reserve, how the DAX performs on the witching day, or how much gold rises around the turn of the month? Such and many other questions can be quickly answered with the appropriate tools. The next chart shows you the average performance of the gold price around the turn of the month as an example. The left half represents the period ten trading days before, and the right half ten trading days after the first day of the month (red horizontal line). The average was determined based on the returns of nearly 15 years or 179 monthly turns.
Source: Seasonax
As you can see, gold achieved its performance mainly in the two days around the turn of the month. These mere two days brought investors an average of 4.9% per year, while the remaining 19 days only achieved 0.9%! Very few gold investors are likely aware of this effect – and there are thousands of such patterns that investors and traders can profitably use.
The DAX over the year
There is already a great variety in annual seasonality. It becomes even greater when other cycles or event studies are added. But how can you, as an investor, quickly recognize these opportunities? One means of doing so is seasonal charts.
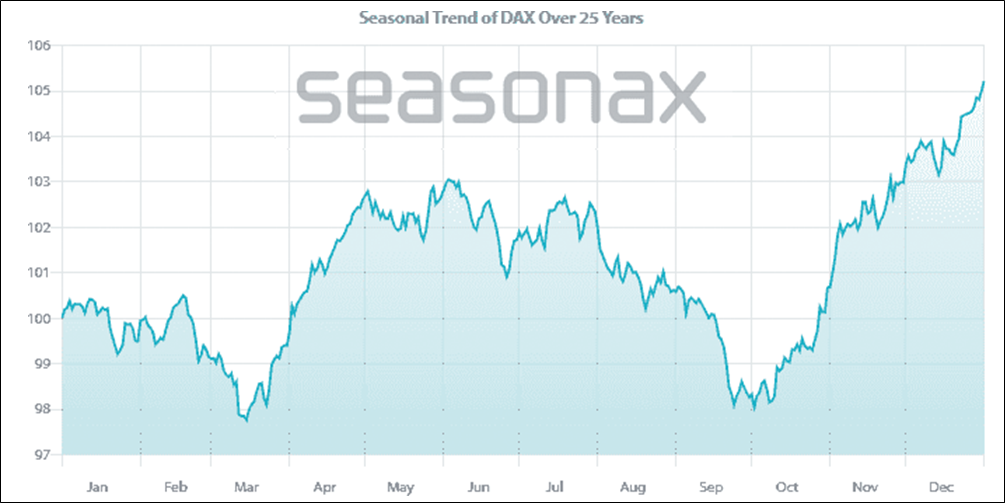
Unlike regular charts, seasonal charts do not show prices over a specific period. Instead, the seasonal chart represents the typical trend at a particular time of the year. The next chart shows you the seasonal trend of the DAX calculated over the average of the past 25 years. The horizontal axis shows the time of the year, and the vertical axis shows the price information. So, you can see the seasonal trend of the DAX at a glance, depending on the time of year.
Source: Seasonax
As you can see, the DAX sprints off after a laborious start to the year in March. However, it comes to an abrupt halt at the beginning of May – “Sell in May and go away” springs to mind. It continues slightly downwards until the end of July, only to experience sharp declines in August and September. In October, the previously introduced autumn rally with its strong performance begins.
The advantages of the seasonal chart are considerable. While the division of the Halloween Effect into the summer and winter half-year only provides rough indications, the seasonal chart shows you exactly when which performance occurred. So, for example, there was a sideways movement even in the seasonally good winter half-year from early January to mid-February, followed by a downturn until mid-March. Conversely, you can see in the seasonal chart the extent of the respective movement. This is a far greater amount of valuable information than the Halloween Effect brings.
Outperforming with individual stocks
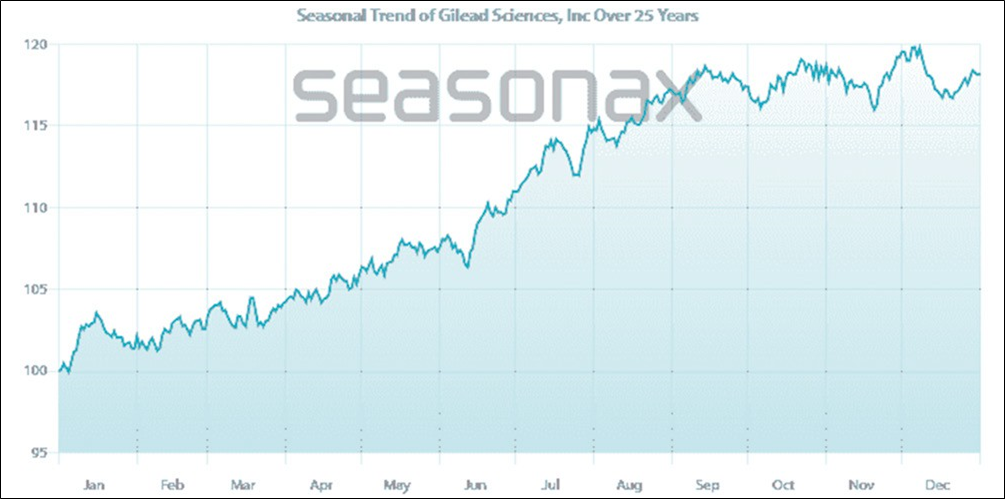
With the instrument of the seasonal chart, we can now turn to the seasonality of individual stocks, which, as mentioned, can have seasonal trends different from the index. Look at the seasonal chart of Gilead Sciences, an American pharmaceutical and biotechnology company.
Source: Seasonax
As you can see, there is a strong upward trend for Gilead Sciences from May to mid-September – that is, during the time of the usual summer weakness of the overall market in the course of the Halloween Effect. On the other hand, from mid-September to the end of the year, there is a sideways movement – that is, during the time of the autumn rally when the overall market (also in the USA) performs well. Thus, Gilead Sciences runs seasonally largely contrary to the overall market.
Therefore, it is worthwhile to look at the seasonal trends of individual stocks. It makes perfect sense to invest in Gilead Sciences during the summer weakness, and then switch to the broad stock market in the fall. By following this simple approach, an investor combines the seasonally favorable phases of two different instruments. Instead of staying out of the market during the weak summer half-year, Gilead Sciences delivers good performance – or other stocks with a similar trend. Voilà, a first seasonal strategy is born!
The Seasonality of Microsoft compared to the overall market
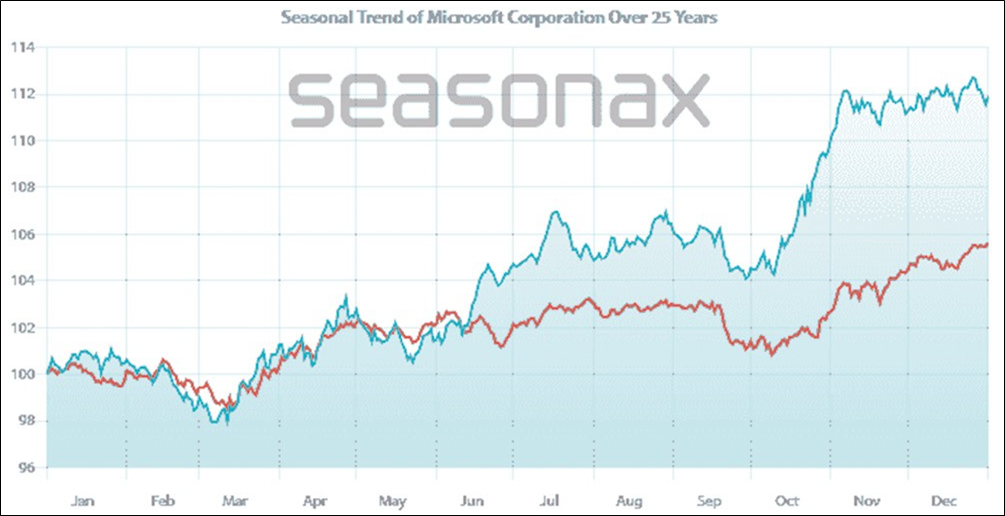
This seasonal strategy can be expanded. An example of this is Microsoft. The American software company has achieved high outperformance in recent years. But what most investors don’t know: This outperformance occurred in only a few weeks of the year. Look at the seasonal chart of Microsoft. In red, I have drawn the seasonal line of the S&P 500 for comparison. As you can see, the Microsoft course ran parallel to the S&P 500 most of the time. Only from mid-June to mid-July and then especially from the second week of October to early November did the price rise more than the index. In November and December, there was even underperformance.
Source: Seasonax
What does this mean? An investor could have been invested in Microsoft only during the two relatively short positive phases, and an S&P 500 investment would have sufficed for the rest of the time. This would have resulted in the entire outperformance of Microsoft – even a bit more due to the underperformance in the last two months of the year.
The Outstanding seasonal phase of Microsoft
The great advantage of seasonality in individual stocks results from another fact: If investors had not been invested in Microsoft during the time when it performed at best average, they would have had funds available not only for the overall market but also for other stocks.
The choice can fall on the stocks that have a high seasonal outperformance at other times of the year. Based on this, a highly efficient seasonal trading strategy can be built.
Source: Seasonax
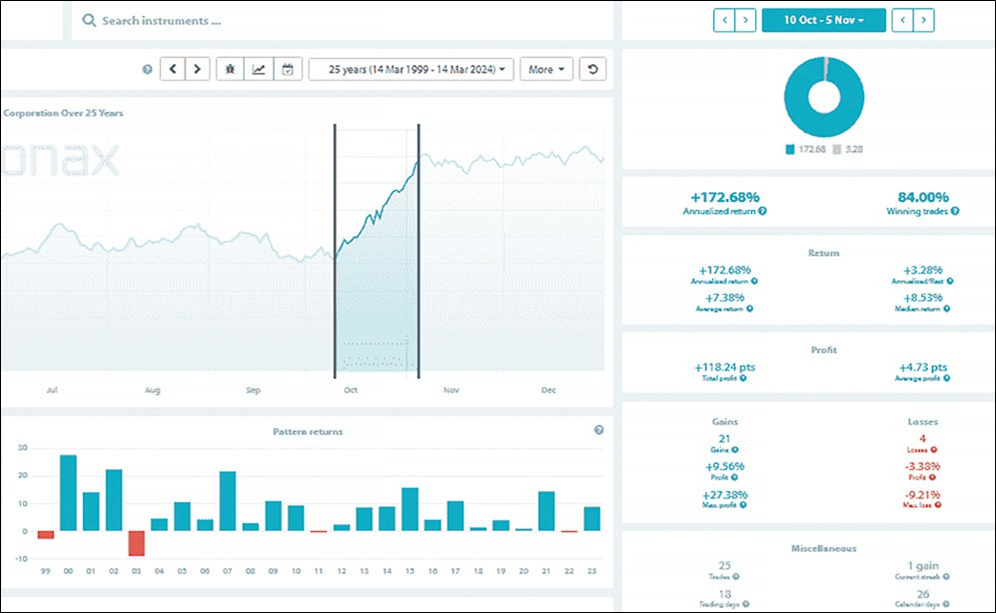
Let’s take a closer look at the second phase, during which Microsoft achieved particularly high seasonal outperformance. I’ll show you an excerpt from the Seasonax internet application, which allows for extensive seasonal statistics similar to a trading system with just a few mouse clicks. Highlighted is the seasonally strong phase for Microsoft, which lasts from October 10th to November 5th.
As you can see from the right-hand side of the figure, Microsoft recorded a price gain in this phase in 21 out of 25 cases. The average gain was 7.38 percent, which, due to the short duration of only 18 trading days, corresponds to an annualized return of 172.68 percent. For comparison, Microsoft’s annualized return during the rest of the year was only 3.28 percent. What a stark difference! This seasonal phase of Microsoft is truly outstanding.
By the way, the reason for this exceptional performance of Microsoft during this phase lies in its quarterly reports. Four times a year, the company reports its quarterly earnings. Until then, investors and analysts have formed certain expectations about these earnings. The figures released in early October typically exceed these expectations by a significant margin on average. This leads to the strong price increase marked in the seasonal chart. In the other three quarters, there were no such high “earning surprises.”
Roll from one seasonal opportunity to the next!
Microsoft was one of the best performers in recent years. However, as shown, the outperformance occurred in only two short phases throughout the year. But Microsoft is not alone in having good seasonal phases. Even stocks that perform on average or below average can have excellent phases with above-average or far above-average performance. The same applies, of course, to commodities and other investments. Thus, we come to a systematic seasonal investment strategy. At Microsoft, the best seasonal phase, as shown, runs out on November 5. Then it’s time to select the next seasonal opportunities and invest in them. The strategy works as follows: When the good seasonal phase of one stock ends, roll into the next stock – and then into the next one, and so on.
Source: Seasonax
Five ways to improve your returns with seasonality
In practice, there are more types of seasonal trading strategies than just the one shown. You don’t have to give up your current trading approach that you have been successfully using. Instead, you can use seasonality to further increase your chances. Additionally, you do not have to change your market outlook – bullish for technology stocks, commodities, or cryptocurrencies – when using seasonal trading approaches. Rather, you can incorporate seasonality into your trading result within your market outlook. You can use seasonality in the following five ways when investing and trading:
- Direct Trading: Seasonal patterns can be traded directly. For example, you can go long during the autumn rally. With this method, make sure that the individual investment is not too large and that a stop-loss is used.
- Timing: Seasonal patterns can be used for timing. You can buy stocks at the beginning of the autumn rally in November and not at its end in early January. This method can also be used by investors whose investment horizon is longer than a seasonal pattern by optimizing entry and exit points.
- Filter: Conversely, investors who are very short-term oriented can use longer-term patterns. This is done by using seasonal patterns as a filter. For example, day traders can avoid taking a position when seasonality is negative. The number of trades is reduced this way, but the probability of winning trades increases. The well-known trader Larry Williams – among other things, inventor of the Williams %R indicator – regularly uses this method.
- Additional Input: You can also use seasonality as an additional input factor to your existing trading approach – whether it belongs to fundamental or technical analysis. If, for example, you trade your stocks with a trend-following approach along with a fundamental filter, you can simply add the seasonal trend as another decision criterion. Since seasonality, unlike other trading approaches, is based on the calendar, you are combining uncorrelated input factors in this way. This type of combination increases the likelihood of positive trades optimally.
- Selection: This is the approach already presented above (using Microsoft and rolling from one instrument to the next). Here, you review your portfolio at regular intervals, for example, once a month. You then invest in the stocks or commodities that show particularly good seasonality in the following weeks. After another month, you repeat this process, selling the seasonally less attractive values and rolling into the more promising ones.
Simply choose from these five methods the one that suits you best! The point is not to regard seasonality as the sole profitable trading strategy. Rather, seasonality patterns are about probabilities. These can increase your chances of winning in different ways.
Scientific long-term study confirms: Seasonality is one of the best investment strategies!
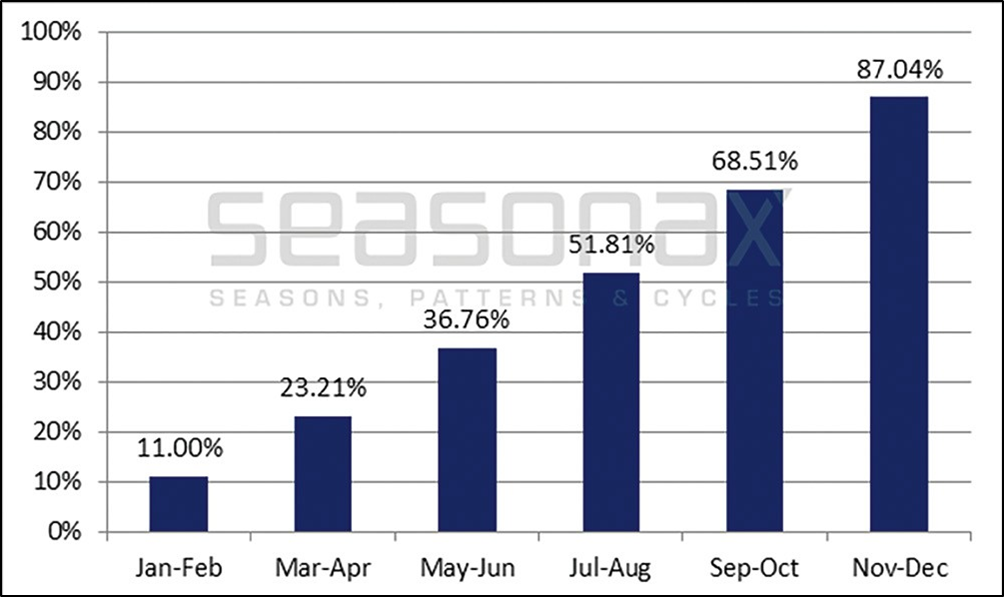
The benefit of seasonality as an investment strategy is also confirmed by academic studies. Among them is the one with the longest history to my knowledge. This extremely long-term study evaluates data with a history of up to 217 years! Researchers Guido Baltussen and Laurens Swinkels from Erasmus University in Rotterdam, along with Robeco analyst Pim Van Vliet, used data in a study (“Global Factor Premiums” SSRN id 3325720) dating back to 1799.
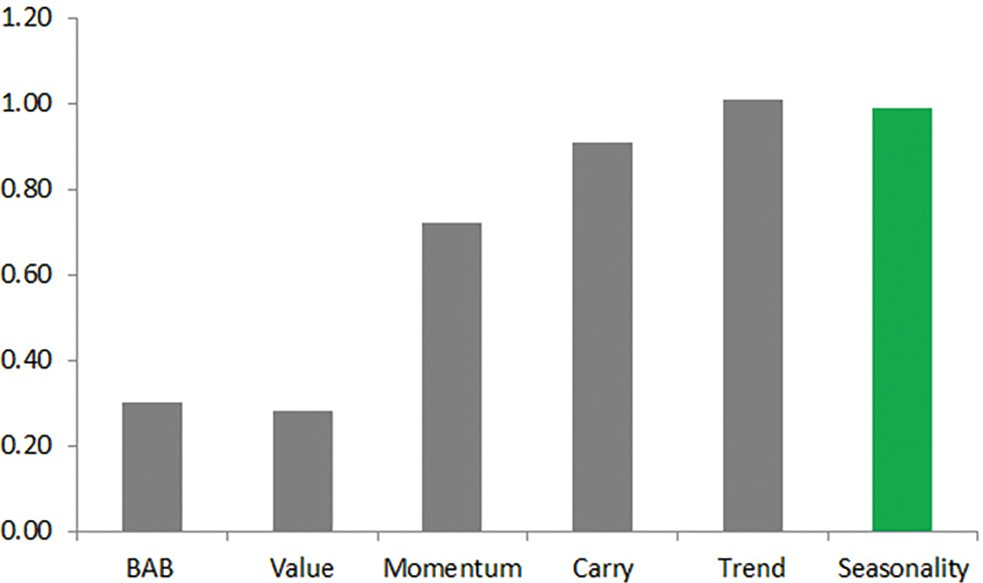
They use many different time series and examine a total of 68 markets from four asset classes. These include stocks, bonds, currencies, and commodities. In these markets, the study authors compare the following six investment strategies: Betting Against Beta (BAB), Value, Momentum, Carry, Trend, and Seasonality. Thus, the authors consider the most popular investment strategies in their extensive study.
The result of the study with an investigation period of over 200 years: Across all asset classes, the seasonality strategy, alongside the trend strategy, is the best investment strategy! Look at this in terms of the Sharpe ratio. It relates performance to risk (specifically volatility). Thus, it takes into account both performance and risk in one number. The authors come to a value of 0.99 for the seasonal strategy. In contrast, the popular value strategy reaches only a value of 0.28 – less than a third! The bar chart illustrates the results of this study. The extensive study thus confirms the benefits of seasonality. It is therefore advisable for investors to use seasonality – regardless of the asset class. Particularly pleasing is that seasonality can easily be combined with other investment strategies. Take up this information and use seasonality in your investment decisions!
Source: Guido Baltussen, Laurens Swinkels, Pim Van Vliet; Seasonax