Dear Investor,
Annual seasonality is undoubtedly the most important cycle for you as an investor. But there are also cycles with different durations. In the 30 December 2020 issue of Seasonal Insights I e.g. discussed the 4-year cycle, also known as the election cycle.
However, there are even longer cycles.
Today I would like to present an analysis of the longest calendar-based cycle known to exist in the markets: The 10-year cycle.
The decennial cycle in the Dow Jones Industrial Average
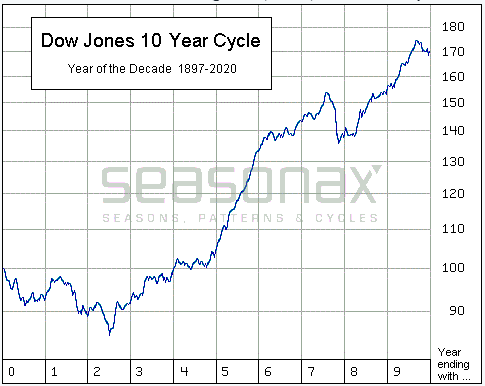
The chart below depicts the pattern of the DJIA by decade from 1897 onward. This decennial cycle chart thus shows the average 10-year pattern of the index over more than 120 years.
On the left-hand side of the chart above the “0” one can see the average pattern of all years ending in the digit “0” (such as 2000, 2010 or 2020). Thereafter follows the seasonal pattern of years ending in “1” (such as 2001 or 2011) and so forth, until we arrive at the complete decennial pattern.
Dow Jones Industrial Average, 10-year cycle, over the past 124 years

A steep ascent is beginning in year 5!
Source: Seasonax
As can be seen, the stock market does appear to be following a 10-year cycle. In the first half of the decade – i.e., in the years ending in “0” up to the years ending in the digit “4” – stocks posted almost no gains on average; by contrast, they tended to rally significantly in the second half.
DJIA stocks delivered an exceptionally strong average performance in years ending in the digit “5”. The average gain amounted to 26.8%. This corresponds to more than one third of the entire average 10-year return! However, in years ending in 7, strong slumps frequently occurred.
Rather problematic pattern until the middle of years ending in “2”
A seasonally weak phase typically occurred until the middle of years ending in “2” as well – such as e.g. 2002 or 2022. Does this indicate that the DJIA is at risk of suffering a period of seasonal weakness?
Does the 10-year cycle actually exist, or is it a myth?
If it exists, there would have to be sound reasons explaining the trends of the decennial cycle. Otherwise it would be an entirely random pattern. However, what the drivers actually are is not quite clear. Possibly knowledge of the calendar is by itself triggering important economic or monetary policy decisions – somewhat akin to making new year’s resolutions on a personal level.
There is in fact some evidence for this. Thus major turning points in the markets have often coincided with the turn of the decade. Examples for this phenomenon are the gold price peak in January 1980, or the Nasdaq top in early 2000. Japan’s Nikkei 225 Index actually experienced a major long-term trend reversal precisely at the end of the decade, on the very last trading day of 1989!
You can make use of annual seasonality easily!
To be honest, I am of two minds regarding the 10-year cycle. Perhaps it does affect the markets, which would currently suggest that a difficult phase for the DJIA lies ahead until the middle of 2022. However, I suspect that the impact of the 10-year cycle – provided it exists at all – is actually weaker than that of cycles of shorter length.
This is due to the fact that annual seasonal patterns are usually underpinned by a very sound rationale. The drivers range from the weather to recurring events such as trade shows, accounting deadlines or quarterly earnings reports. At www.seasonax.com you will find an almost unlimited array of possibilities in this context. Come and take a look!
Yours sincerely,
Dimitri Speck
Founder and Head Analyst of Seasonax
PS: The 10-year cycle could impact the Dow Jones Industrial Average!


