Dear Investor,
There is no doubt that a Triple Witching Day brings notable price swings. Curious about how to capitalize on this?
Today I will try to unravel the enigma behind this event, its impact on the stock market, and the seasonal nuances accompanying it.
Mark your calendars for the third Friday of every last month in a quarter – March, June, September, and December. This is when Triple Witching unfolds. The term signifies the concurrent expiration of three specific securities: stock index futures, stock index options, and stock options. Interestingly, this phenomenon was previously referred to as the “Triple Witching Hour” — pointing towards the final hour of trading on these Fridays.
Upcoming Triple Witching Days
- 2024: September 20, December 20
- 2025: March 21, June 20, September 19, December 19
Three’s Company: The Dance of Stock Options, Futures, and Index Options
One of the primary implications of a Triple Witching Day is the surge in trading volume and market volatility. Traders and institutional investors scramble to offset, close, or roll over their positions. This leads to frenzied activity and abrupt price movements.
The simultaneous expiration of multiple derivatives can create temporary price inefficiencies. Savvy traders often seek out arbitrage opportunities that arise from price disparities between the underlying assets and their derivatives.
However, derivatives’ expiry isn’t the only thing that happens on the third Friday of every third month of the quarter. Indexes like the S&P, FTSE also adjust their values on this day (with the exception of Nasdaq 100, which does its annual rebalance only on the third Friday in December).
Historically some studies have suggested that Triple Witching Days tend to have a bullish bias, particularly in December. But this could simply be a reflection of the broader “Santa Claus Rally” phenomenon: where stock markets, especially in the US, have historically shown a tendency to rise during the last week of December.
While many investors are focused on Triple Witching Day itself, I decided to analyze a period of several trading days before and after the expiration date.
My primary focus was on understanding the impact on individual stock investments.
When is the right time to bite an Apple?
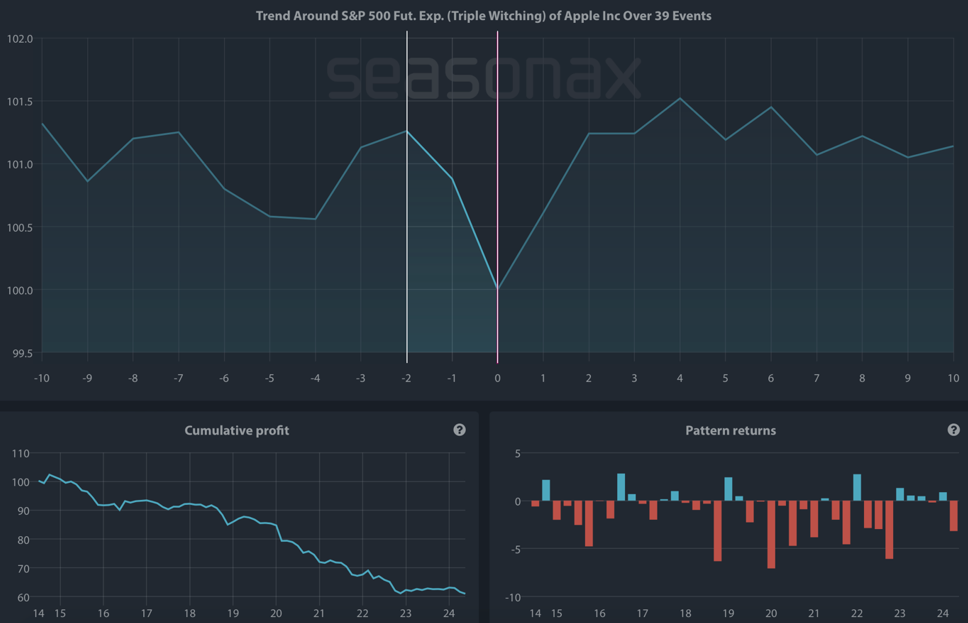
The event chart below shows the average course of Apple in the ten trading days before and after the Triple Witching expiration days.
The chart was calculated over the past ten years, during which there have been 39 Triple Witching Days. The horizontal axis shows the number of trading days before, and after, the event took place. The vertical axis shows the average trend in percent.
The red line marks the day of the event the Triple Witching Day. In this way you can see at a glance what the typical course of Apple share prices look like around the Witching Days.
Average price move of Apple in the 10 days before and after Triple Witching Day

Source: Seasonax – Chart is based on 39 events between 2014 and 2024 .
It’s evident that Apple’s price usually drops two days prior to Triple Witching expiration, with an average decline of 1.23% over these two trading days.
For you as an equity investor, it’s statistically favorable to buy this particular stock close to the end of a Triple Witching Day. You can use this effect as a trader, but also as a long-term investor, to improve your entry timing.
Mind over Market
There’s also a psychological aspect to Triple Witching Day. Some traders tend to be superstitious, believing that these days bring bad luck or are a precursor to unfavorable market shifts. While this might sound irrational, the collective belief can sometimes sway market sentiment and become a self-fulfilling prophecy.
Some of the most turbulent days in the stock market have coincided with Triple Witching, such as in 1992 when sell-offs in IBM, General Motors, and other blue chips led to a significant market decline on a Triple Witching Friday.
While being aware of the price movements around the Triple Witching Day are a great help in improving investment returns, it’s essential to remember that, like all market phenomena, it’s just one of many factors that influence stock prices.
By using the Seasonax Event Feature, you can examine different events reaching from economic data releases, central bank decisions, specific holidays or even the turn of the month effects. Try them out now: www.seasonax.com
Yours sincerely,
Tea Muratovic
Co-Founder and Managing Partner of Seasonax


