Dear Investor,
A topic that is increasingly taking center stage in recent weeks, even overshadowing state enemy number 1, the corona virus, are the upcoming US elections. All eyes will be on Tuesday, November 3, when the presidential elections take place. Will the 59th presidential elections be changing history and set a new tone, or will the term America First continue to be at the forefront over the coming 4 years?
Seasonality and the Upcoming Elections
In a time when the market is facing plenty of uncertainty due to the public health crisis and the jittery global economy, we will provide you at least with statistical evidence of probable market trends. The past performance of equity markets has shown that the market’s direction is not determined by whether a Republican or a Democrat is elected president, but rather by the election cycle we are in.
The four-year cycle revolves around the US Presidential elections and comprises the election, post-election, midterm and pre-election years.
Election Year vs. Non-Election Year Trends:
The trend of US benchmark indexes depends on whether the current year is an election year or a non-election year (i.e., the one, two, or three years following an election year). Stocks tend to post bigger-than-average gains in the year prior to an election year, as well as in the election year, immediately before the election itself. It is assumed that this behavior is driven by domestic fiscal and monetary policy. Rising stock prices and a booming economy are intended to help the incumbent administration get re-elected.
S&P 500 Index Election Year Behavior
In this issue of Seasonal Insights I present a close examination of the S&P 500 Index and its pattern during the election year based on Dimitri’s Speck’s analytical studies.
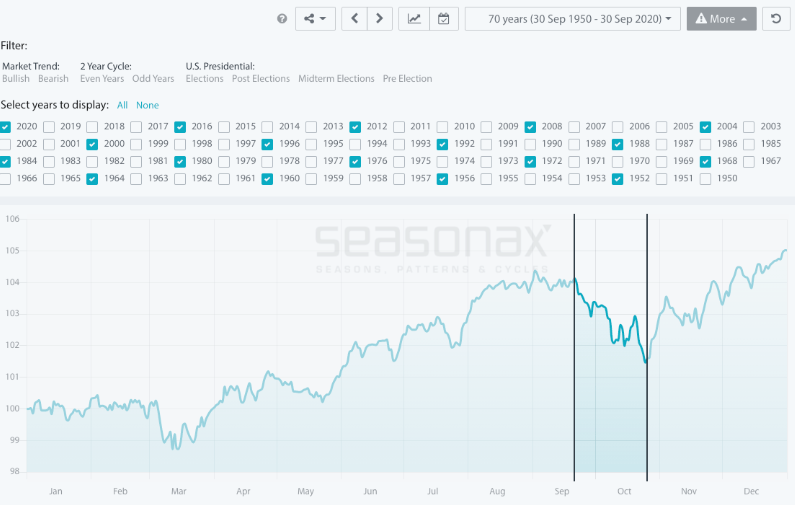
Note: unlike a standard price chart that simply shows stock prices over a specific time period, a seasonal chart depicts the average price pattern of a stock (or index) in the course of a calendar year, calculated over several years. The horizontal axis depicts the time of the year, while the vertical axis shows the level of the seasonal pattern (indexed to 100). With that in mind, let us examine the seasonal chart of S&P 500 Index. Please be aware that the years that are included into our analysis refer to the election years only from 1952 onward (1952, 1956, 1960, 1964, 1968 … 2020).
Seasonal Chart of the S&P 500 Index during Election Years

The S&P 500 Index typically delivers weak seasonal returns during the months of September and October.
Source: Seasonax (click here to highlight the above mentioned period on the chart and have a closer look at a detailed statistical analysis of the pattern)
It is interesting to observe how the 4-year pattern changes during different years in the cycle (election, post-election, midterm and pre-election year).
I have highlighted the weak seasonal phase from September 21 to October 26 during election years. On average the S&P500 Index has delivered a very poor annualized return of -27.12% during this period.
Even more important is the pronounced consistency of the negative returns generated during this phase, which suggests that this pattern is highly reliable.
The bar chart below depicts the return delivered by S&P 500 in the relevant time period from September 21 to October 26 during all election years since 1952. Red bars indicate years with negative returns and blue bars years with positive returns.
Pattern return during all election years since 1952

On our seasonal chart it is immediately apparent that the index tends to move sideways up to the end of May. The trend completely changes toward the end of the year, when the election is held as well. At the end of May until September we can identify a first strong upward movement. After that the usual decline in September and October typically takes place.
Apart from the US stock market, the currency and bond markets are also subject to four-year cycles. Particularly noteworthy in the bond market is the fact that in the year prior to the election it is typically quite weak. It is exactly reciprocal to the stock market, which strengthens the assumption that the two markets are inversely correlated due to investment preferences and reallocation measures.
Market Moves Immediately Before Elections
In addition to the election cycle there is still another, not widely known phenomenon related to the election. The movement of the US equity market directly before and after the election.
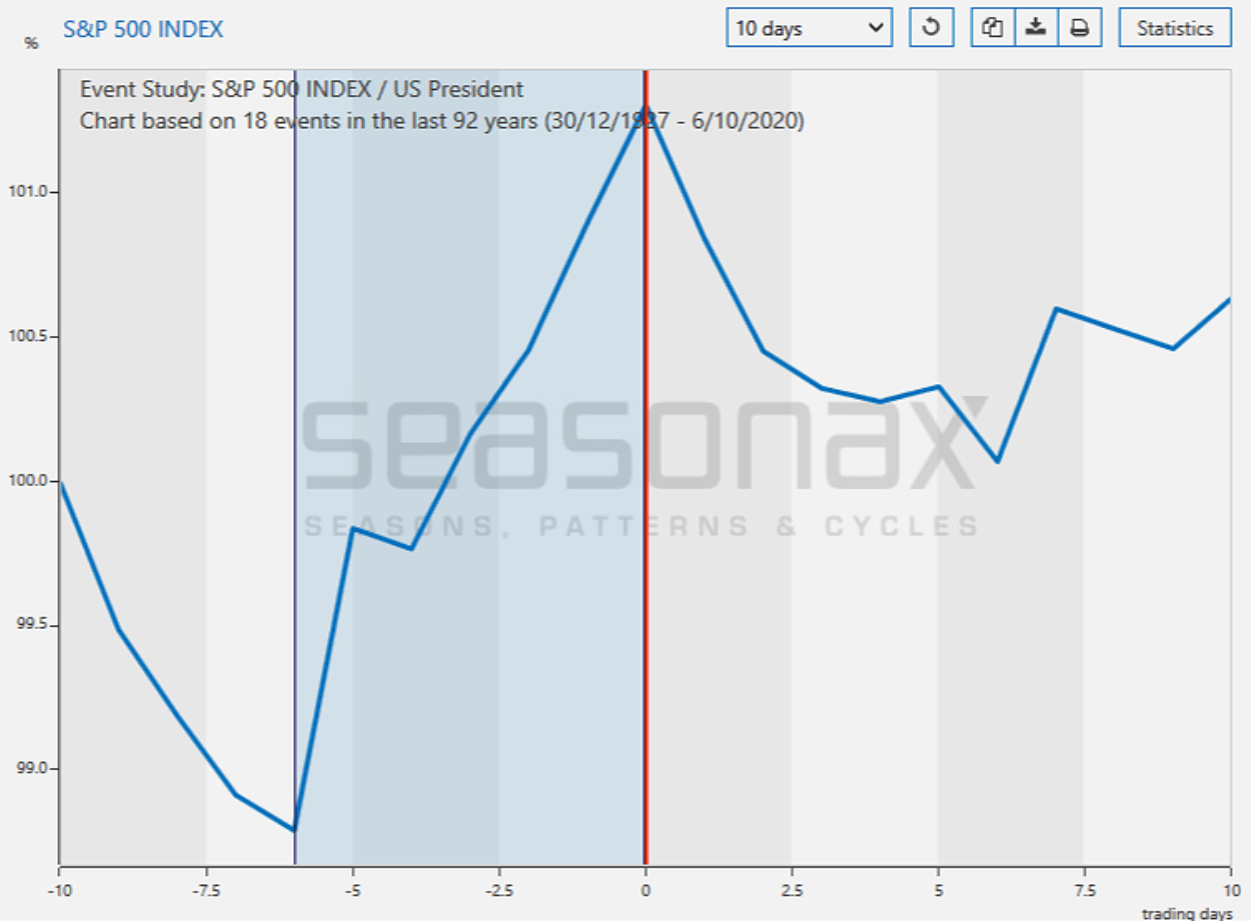
To examine this phenomenon we have constructed a special chart. It shows the average S&P 500 price in the 10 days immediately before and after the day of the election (marked on the chart with 0).
Seasonal pattern of the S&P 500 Index 10 days before and after the elections

The S&P 500 Index typically rallies sharply in the 6 days before the election!
Source: Seasonax integration in Bloomberg & Thomson Reuters / Refinitiv Eikon
We can clearly see that in the days prior to the election, stock market prices tend to rally sharply. Prior to an election sentiment improves, as people hope for their candidate’s victory and a fresh impulse is expected from the new team in the White House. This optimism, even if it is caused by something unrelated to stocks, stimulates buying interest.
Enter the world of seasonal opportunities
Apart from S&P 500 Index during the election year that we have presented in this issue of Seasonal Insights, there are numerous other stocks that display regularly recurring weak and strong seasonal periods.
Make use of the enhanced filtering function within Seasonax to analyze seasonal trends of specific years like the US elections.

Yours sincerely,
Tea Muratovic
Co-Founder and Managing Partner of Seasonax


