Dear Investor,
In the tech industry, six American companies have achieved valuations of at least $1 trillion, with five of them surpassing the $2 trillion mark.
These giants—Apple, Microsoft, Alphabet, Meta, Nvidia and the latest $2 trillion member, Amazon—are not only leaders in their fields but also pivotal in driving innovation, shaping market trends, and influencing investor sentiment.
Though they dominate the S&P 500 and Nasdaq 100 now, will they maintain this lead, or will new contenders or startups disrupt their reign?
What Do Seasonals Say?
Despite generating more revenue than its peers, Amazon’s lower profitability has historically kept its valuation in check. However, recent strategic changes are boosting its bottom line, and its growing role in AI is drawing investor attention.
So, is now the best time to invest ?
There are mixed feelings when it comes to an answer.
Amazon’s stock benefits from seasonal trends, especially during the first half of the year (January to July). However, the second half tells a different story.
Over the past decade, from July 24 to December 24, Amazon has averaged negative returns of over -4.24%. This seasonal weakness is crucial for investors to consider.
Amazon – Detrended Seasonal Chart, Calculated Over 10 Years
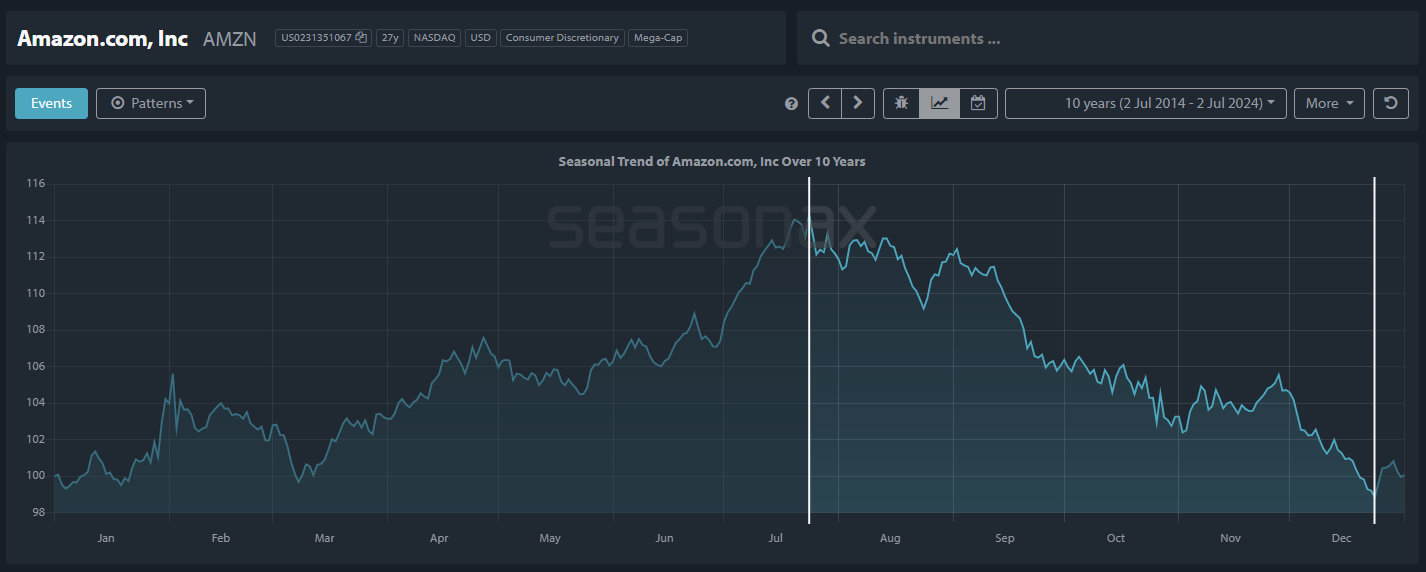
Source: Seasonax, sign up here https://app.seasonax.com/signup to access further analysis, 30 days for free
How to read detrended seasonal charts? * By using our function to detrend charts, we use statistical methods to separate trend from time. This means that the overarching uptrend will be subtracted out which is especially useful for “high flyer” stocks that show a constant uptrend in the past years.Thereafter you will immediately and quite clearly discern in what time periods the relatively weak phases are located. This way, it is easier to analyze and identify cyclical patterns.
August Chill for Microsoft
According to seasonal trends, August doesn’t look promising for other members of the trillionaire club. Apple, in particular, shows signs of cooling off during this month.
This is strongly visible when using the “detrending” feature in the seasonal charts.
With detrending, you can quickly identify the relatively weakest phases for instruments that have risen significantly in recent years “high flyers”—and may correct downward particularly sharply in weak market phases. Such phases might be of interest for short traders.
Microsoft, Detrended Seasonal Chart, Calculated Over 10 Years
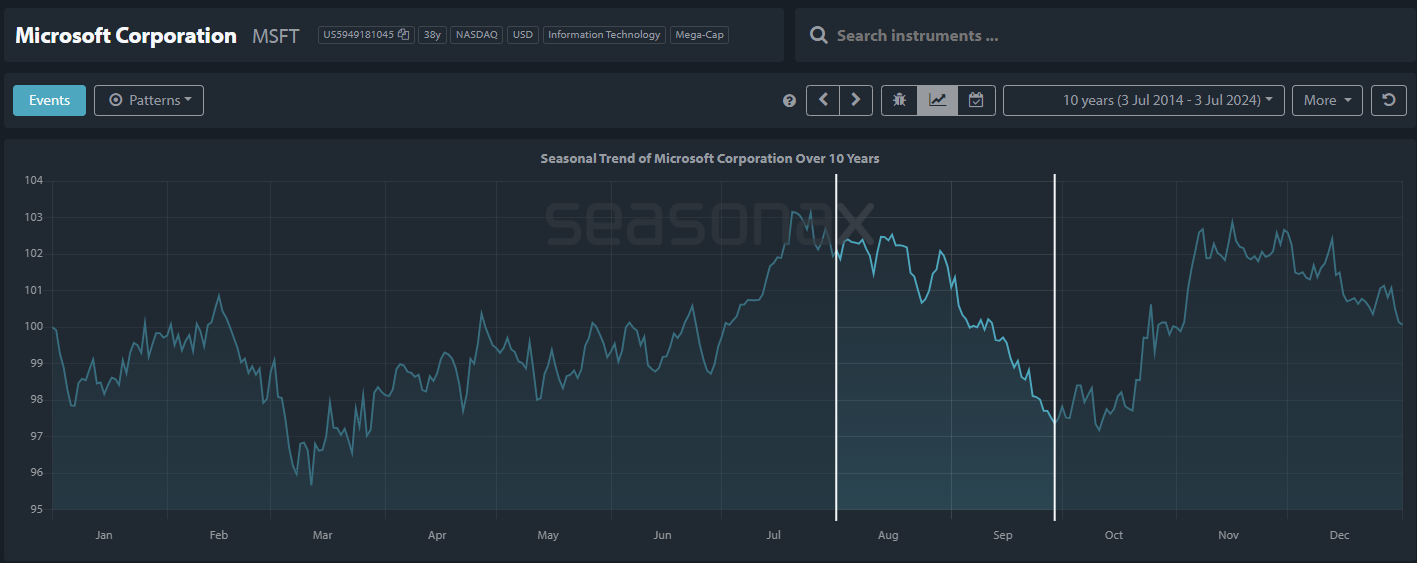
The seasonal weak phases are now clearly visible. Source: Seasonax
Microsoft’s fiscal year ends in June, making the period leading up to it critical as the company strives to meet its targets. This often results in a strong performance and a favorable outlook in the subsequent earnings report in July.
After the earnings have been reported we can see a weaker phase from August 1 until September 29. Over the last 10 years during this period, we have had an average return of -0.9%, particularly pointing at the last 4 years that have been negative.
Microsoft, pattern returns from August 1 until September 29 over the last 10 years
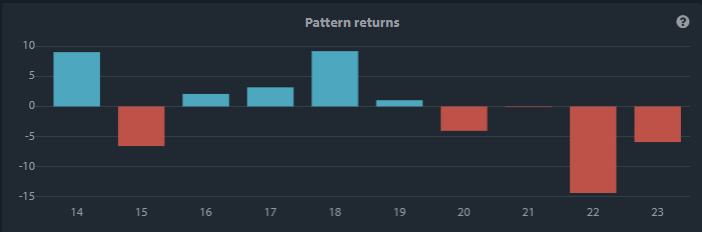
Source: Seasonax , sign up here https://app.seasonax.com/signup to access further analysis, 30 days for free
Afterwards, Microsoft enjoys a robust fourth quarter, thanks to increased consumer and enterprise spending. The holiday season is a prime time for selling Surface devices, Xbox consoles, and software.
Don’t Bite an Apple During September
Apple also tends to perform well in the last quarter of the year. The launch of new products often boosts the stock price, followed by strong sales during the holiday season.
From a seasonal perspective, the weakest period for Apple is just before holiday season from September 2 to October 2.
During this 21 trading days Apple had negative returns of -4.12% during the last 10 years. Also leaving the last 4 years consistently with a negative “taste”.
Apple, Detrended Seasonal Trend, Calculated Over 10 Years
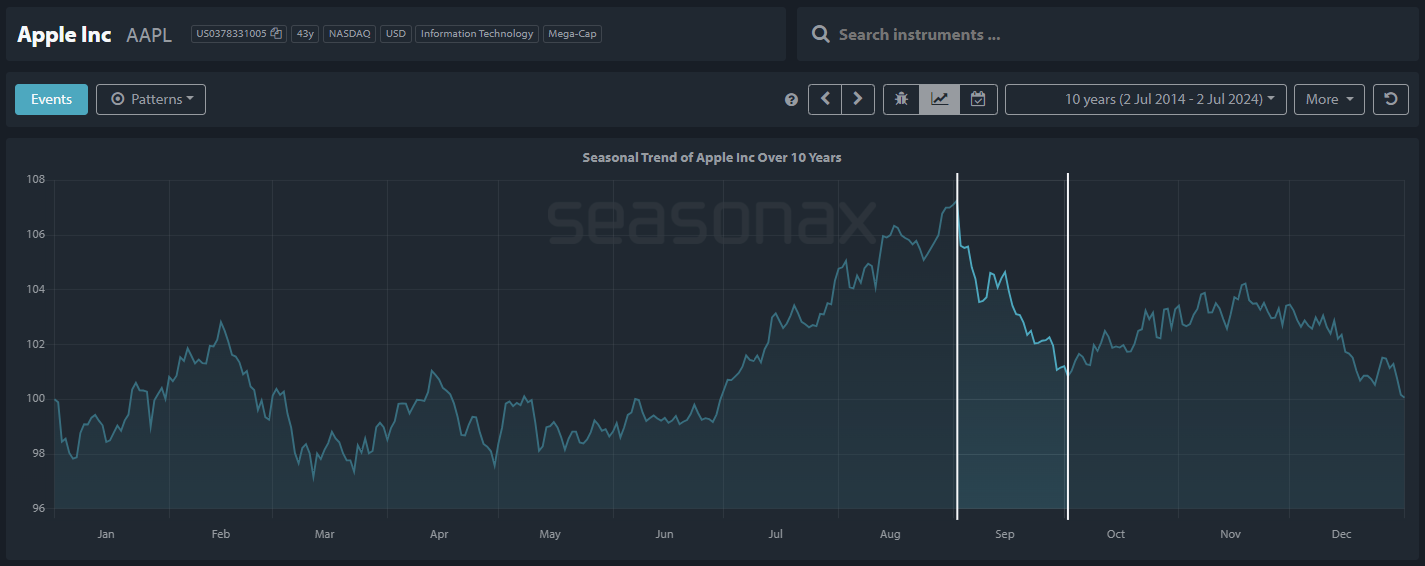
Source: Seasonax, sign up here https://app.seasonax.com/signup to access further analysis, 30 days for free
Making the Most of Seasonal Trends
By understanding the seasonal patterns of trillionaire stocks, you can strategically time your investments for maximum gains. For instance, consider buying stocks before historically strong periods, such as buying Microsoft ahead of earnings reports in October or the holiday season. Conversely, selling or hedging positions before typically weaker periods can protect your portfolio from potential declines.
Utilizing Seasonax will help you pinpoint the best times to enter and exit the market, maximizing your potential returns. As you enjoy the summer festivities, let your investments work for you. Remember, don’t just trade it, Seasonax it!
Test it free for 30 days and explore patterns across various markets, including indices, (crypto)currencies, stocks, and commodities.
Wishing you a profitable summer,
Yours sincerely,
Tea Muratovic
Co-Founder and Managing Partner of Seasonax