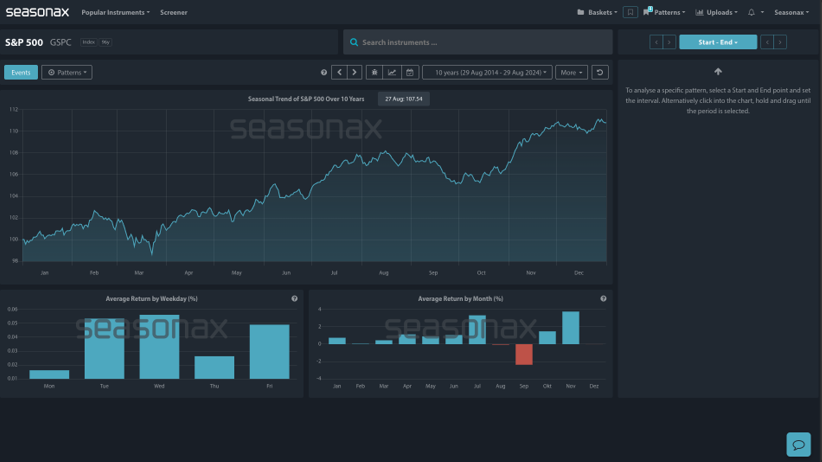
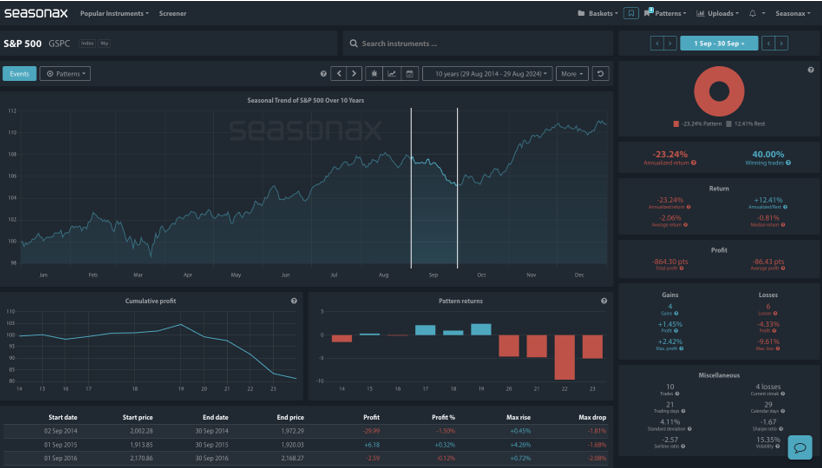
The S&P 500 tends to underperform in September, showing negative returns and higher risk metrics. It tends to be a weak month for returns and over the last 10 years it has been the weakest month. The selected pattern (1st September to 30th September) shows a significant negative annualized return of –23.24%.In contrast, the rest of the year from October 01 through to December 31has an annualized return of +22.13%.
There are many uncertainties in markets right now with the state of the US labour market in intense focus from the Fed. Jolts jobs, ADP, and of course the big US NFP are all out this week. Labour data is highly likely to move markets, especially if we see a strong print on Friday’s NFP. A firm US labour market will mean the Fed can take their time on cutting rates if they want to and that could send the S&P500 sharply lower. The specific seasonal pattern from 1st September to 30th September for the S&P 500 shows a significant negative annualized return of -23.24%, with more losing trades than gains during this period. The average return is -2.06%, and risk metrics like the Sharpe and Sortino ratios are negative, indicating poor performance and higher downside risk. Historically, this suggests that September tends to be a challenging month for the S&P 500, characterised by underperformance and increased volatility. Will this week see further S&P500 selling?
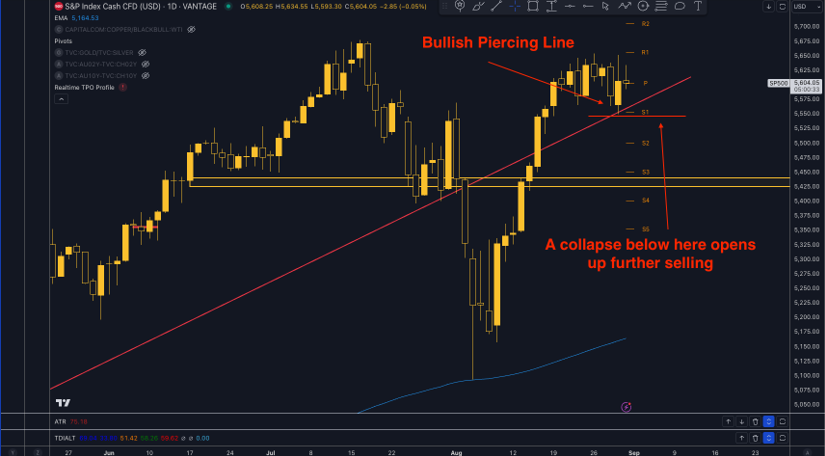
Technically the SP500 sits around all time highs, with a bullish piercing line pattern recently formed at the end of last week on the daily chart. A collapse below 5547 could open the way for a move down to 5500.
Sign up here for thousands of more seasonal insights just waiting to be revealed!
Trade risks
- Long-Term Uptrend: Despite short-term patterns, the overall trend for the S&P 500 remains positive over a 10-year period, so caution on shorting the S&P500 must always be exercised.
Remember, don’t just trade it Seasonax It!