Dimitri Speck, the author of this Blog, is a professional in the field of pattern recognition and the development of trading systems. In the following interview he talks about his career path and walks you through the field of seasonality. Moreover, he informs you about the features of the new version of Seasonax, which just launched on Bloomberg and soon on Thomson Reuters.
1. During the investigation of seasonal patterns, a number of people referred to you as the man of the game. How did you become an expert in your field?
I’ve been interested in statistical methods for improving investment results for as long as I’ve worked with the stock markets. But it’s not as easy to implement them as I initially thought. So I became more and more familiar with this area and also investigated seasonal patterns. An algorithm came out of this almost as a by-product – one that, for the first time, showed day-precise, price-precise seasonal trends. Many people find this hard to believe, but nothing like that existed at that time. Even now a lot of the third-party seasonal charts I come across are wrong.
2. Was mathematics something you were always passionate about?
Yes, I’m mathematically-minded. Even when I was at school, I didn’t do most of the homework but still got good grades. Nowadays I have a more balanced take on things, but I still love, for instance, developing algorithms. Correctly applied statistics help investment success by increasing the returns and lowering the risk.
3. In your new tool everything works around the idea of seasonality. Could you explain any insights in relation to this phenomenon?
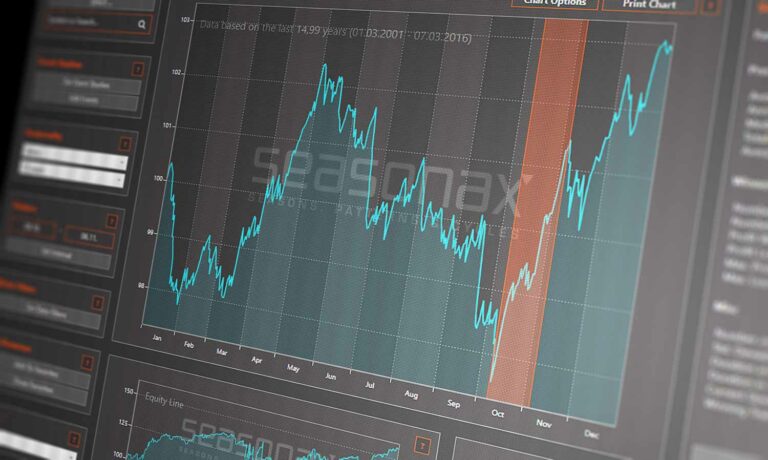
‘Seasonax goes beyond Seasonality’: our app, available on Bloomberg and soon on Thomson Reuters, allows you to analyse and display seasonal trends for all asset classes. For example, you can search for stocks whose prices typically rise in February – due to earning surprises at a specific time of a year because of internal company reasons. Conversely, other shares rise during year-end rallies. And so on. Seasonal trends other than the annual ones are also available on the app such as intraday averages: Does the S&P generally rise at the closing, or the Nikkei at lunchtime? With Seasonax, you can answer these questions with just a few mouse clicks.
4. The second release of the Seasonax app will be available on Bloomberg shortly, so what are the main features that will be available in the new version?
Intra-Year Seasonality, which allows you to investigate how annual trends increase the positive investment of your decisions.
Moreover, with Intraday Seasonality you will be able to improve your day trade timing by optimising entry and exit points.
Another very important new feature that we are introducing is the Event Study. Recurring market reactions around events will allow you to stay ahead of the curve.
5. Why is the app of importance to traders, managers and investors?
Investors can optimise their investment decisions, back them statistically, and make decisions more quickly. At what time of day should I buy? How much should I weight shares right now? Should I buy instrument A or instrument B? Will I buy today or will I wait until the close of the week? You can find a quick answer to all of these questions and more with Seasonax.
And the answers that Seasonax offers are statistically relevant, going beyond what I’ve already described. You can even set the filter to analyze certain years such as election years. Or you can analyze the market reaction on events like the Labour Market Report or the FMOC announcement.
If I had not developed Seasonax myself: I would certainly be looking for it now.


